A new installment of 'sonified' objects from space has been released.
Data sonification is the process of turning information collected by telescopes into sounds.
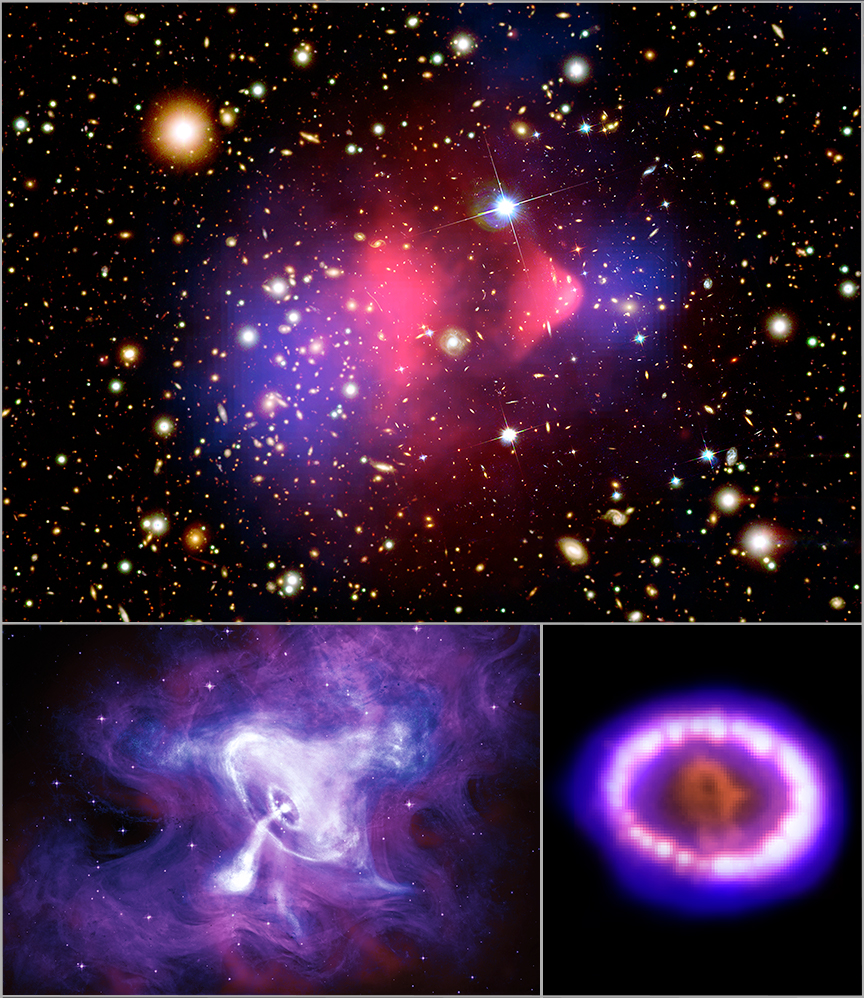
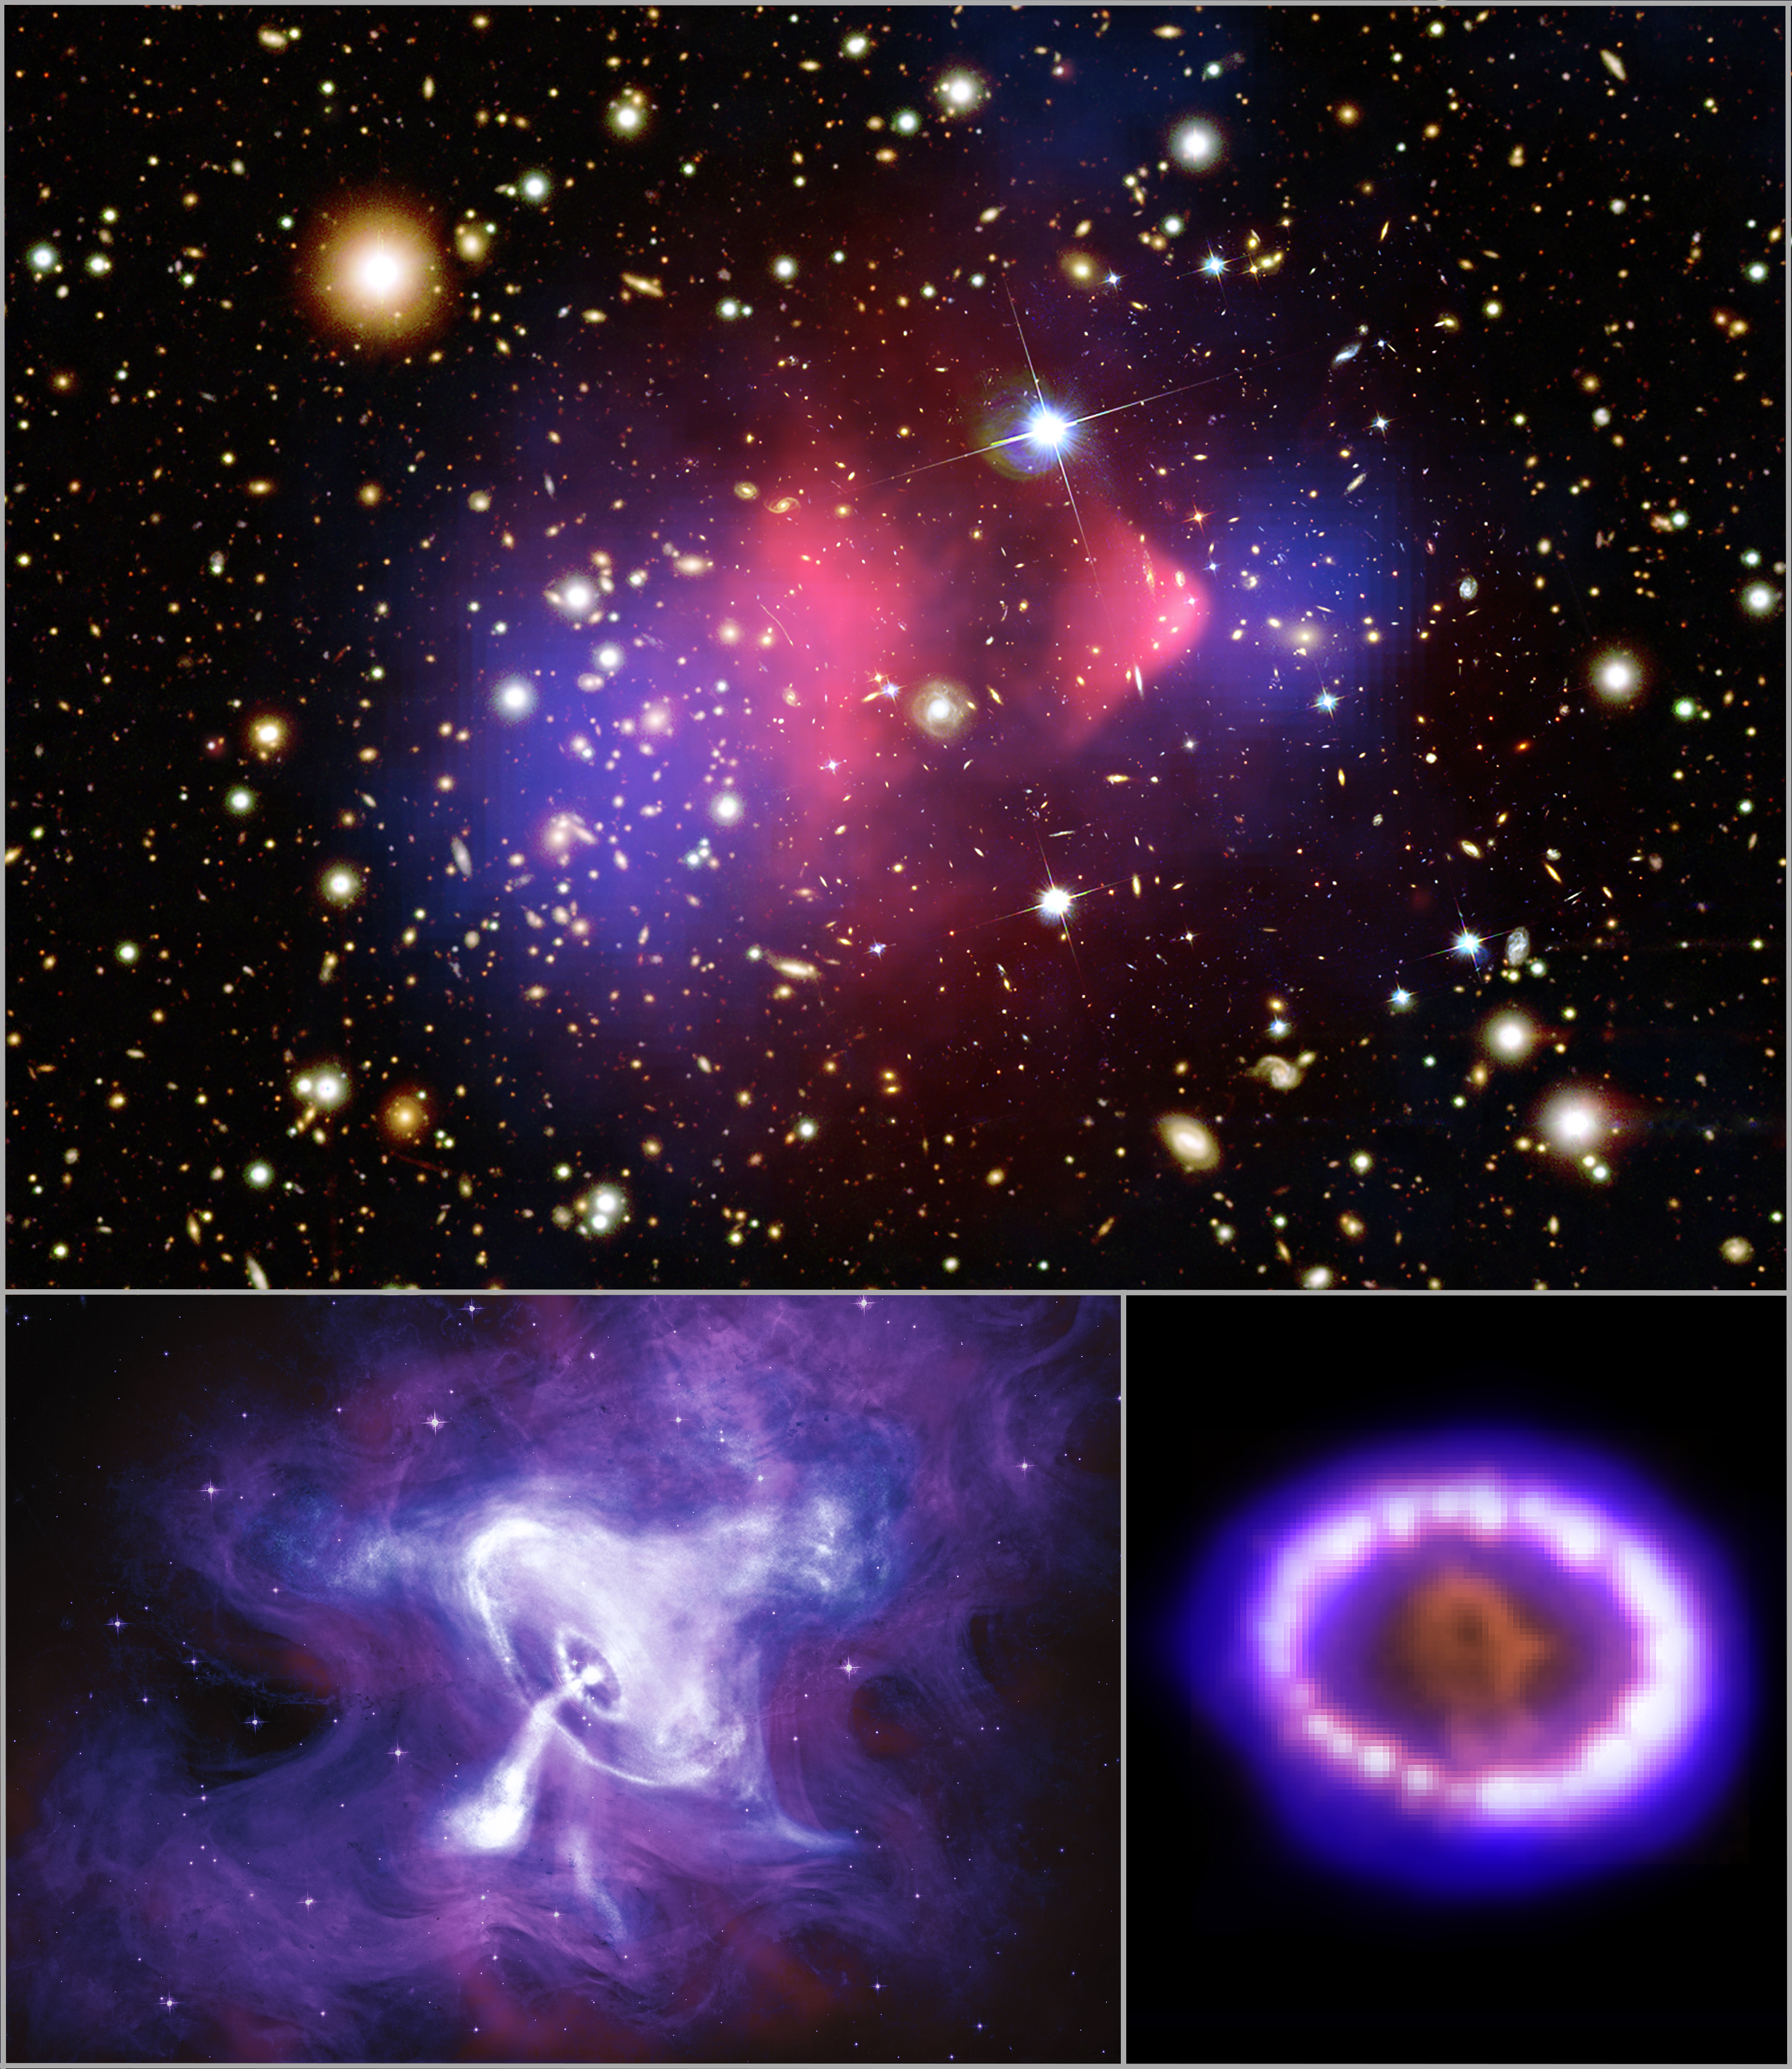
This new trio of images includes the Bullet Cluster, the Crab Nebula, and SN 1987A.
The resulting sounds are based on X-ray, optical and/or infrared data and how they vary across the image.
A new trio of examples of 'data sonification' from NASA missions provides a new method to enjoy an arrangement of cosmic objects. Data sonification translates information collected by various NASA missions — such as the Chandra X-ray Observatory, Hubble Space Telescope, and Spitzer Space Telescope — into sounds.
This image of the Bullet Cluster (officially known as 1E 0657-56) provided the first direct proof of dark matter, the mysterious unseen substance that makes up the vast majority of matter in the Universe. X-rays from Chandra (pink) show where the hot gas in two merging galaxy clusters has been wrenched away from dark matter, seen through a process known as "gravitational lensing" in data from Hubble (blue) and ground-based telescopes. In converting this into sound, the data pan left to right, and each layer of data was limited to a specific frequency range. Data showing dark matter are represented by the lowest frequencies, while X-rays are assigned to the highest frequencies. The galaxies in the image revealed by Hubble data, many of which are in the cluster, are in mid-range frequencies. Then, within each layer, the pitch is set to increase from the bottom of the image to the top so that objects towards the top produce higher tones.
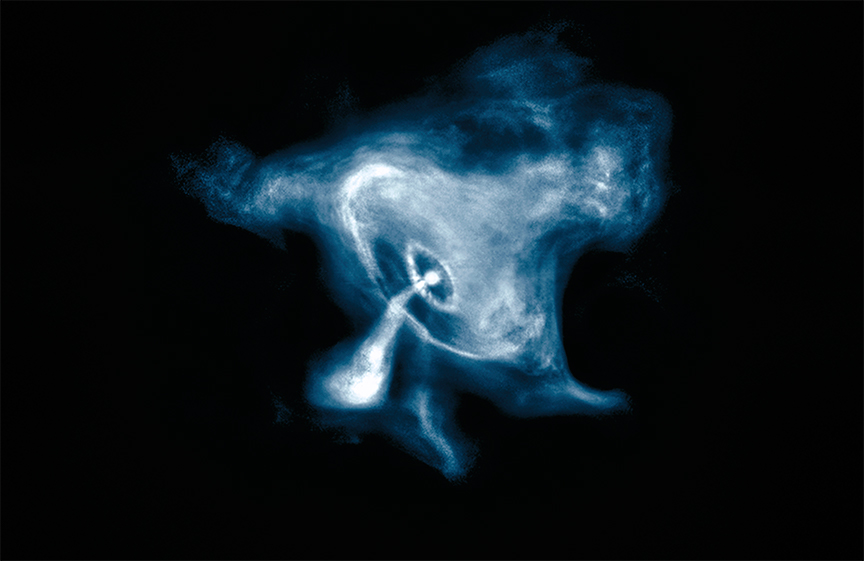
The Crab Nebula has been studied by people since it first appeared in Earth's sky in 1054 A.D. Modern telescopes have captured its enduring engine powered by a quickly spinning neutron star that formed when a massive star collapsed. The combination of rapid rotation and a strong magnetic field generates jets of matter and anti-matter flowing away from its poles, and winds outward from its equator. For the translation of these data into sound, which also pans left to right, each wavelength of light has been paired with a different family of instruments. X-rays from Chandra (blue and white) are brass, optical light data from Hubble (purple) are strings, and infrared data from Spitzer (pink) can be heard in the woodwinds. In each case, light received towards the top of the image is played as higher pitched notes and brighter light is played louder.
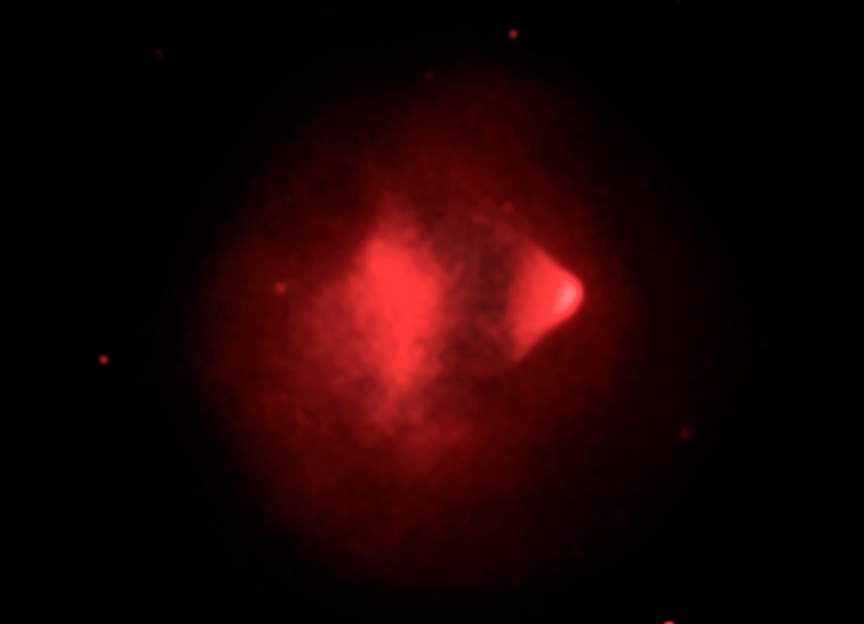
On February 24, 1987, observers in the southern hemisphere saw a new object in the Large Magellanic Cloud, a small satellite galaxy to the Milky Way. This was one of the brightest supernova explosions in centuries and soon became known as Supernova 1987A (SN 87A). This time lapse shows a series of Chandra (blue) and Hubble (orange and red) observations taken between 1999 and 2013. This shows a dense ring of gas, which was ejected by the star before it went supernova, begins to glow brighter as the supernova shockwave passes through. As the focus sweeps around the image, the data are converted into the sound of a crystal singing bowl, with brighter light being heard as higher and louder notes. The optical data are converted to a higher range of notes than the X-ray data so both wavelengths of light can be heard simultaneously. An interactive version lets the user play these astronomical instruments for themselves.
The data sonification project is led by the Chandra X-ray Center (CXC) as part of the NASA's Universe of Learning (UoL) program. NASA's Science Activation program strives to enable NASA science experts and to incorporate NASA science content into the learning environment effectively and efficiently for learners of all ages. The collaboration was driven by visualization scientist Kimberly Arcand (CXC), astrophysicist Matt Russo and musician Andrew Santaguida (both of the SYSTEMS Sound project.)
NASA's Marshall Space Flight Center manages the Chandra program. The Smithsonian Astrophysical Observatory's Chandra X-ray Center controls science from Cambridge Massachusetts and flight operations from Burlington, Massachusetts. NASA's Universe of Learning materials are based upon work supported by NASA under cooperative agreement award number NNX16AC65A to the Space Telescope Science Institute, working in partnership with Caltech/IPAC, Center for Astrophysics | Harvard & Smithsonian, Jet Propulsion Laboratory, and Sonoma State University.
Fast Facts for Bullet Cluster:
Credit
X-ray: NASA/CXC/SAO; Optical: NASA/STScI, Magellan/U.Arizona; Lensing Map: NASA/STScI, ESO WFI, Magellan/U.Arizona; Sonification: NASA/CXC/SAO/K.Arcand, SYSTEM Sounds (M. Russo, A. Santaguida)
Release Date
November 30, 2020
About the Sound
Synthesized sound consisting of combinations of sine waves controlled by data in the image.
Compact sources produce short, pure tones, extended sources such as dark matter/x-ray gas produce noisy roaring sounds.
Optical layer has a harp sound for each galaxy.
Scale
Image is about 7.5 arcmin (7.4 light years) across
X-ray: NASA/CXC/SAO; Optical: NASA/STScI; Sonification: NASA/CXC/SAO/K.Arcand, SYSTEM Sounds (M. Russo, A. Santaguida)
Release Date
November 30, 2020
About the Sound
As the focus sweeps around the image, the data are converted into the sound of a crystal singing bowl, with brighter light being heard as higher and louder notes.
The optical data are converted to a higher range of notes than the X-ray data so both wavelengths of light can be heard simultaneously.
This image is a composite image of the Galaxy Cluster 1E 0657-56, also known as the Bullet Cluster. The galaxy cluster is composed of hundreds of galaxies that are held together by their mutual gravitational attraction. In the image, we can see a large number of gold and white dots and tiny spiral shapes scattered across a dark background. These sources represent individual galaxies within the cluster. The most prominent features of the image is the large bright pink cloudy object in the center overlaying dozens and dozens of the galaxies, which is brighter and more concentrated and is shaped like a very large bullet. The bullet-shaped clump on the right side is the hot gas from one cluster, which passed through the hot gas from the other larger cluster during the collision. This hot gas was detected in X-ray light by the Chandra X-ray Observatory. On either side of the large pink bullet are blue cloudy areas where astronomers find most of the mass in the clusters. The concentration of mass is determined using the effect of so-called gravitational lensing, where light from distant objects is distorted by intervening matter. Most of the matter in the clusters (blue) is clearly separate from the normal matter (pink), giving direct evidence that nearly all of the matter in the clusters is dark matter.
Sounds representing data from astronomical objects.
The objects are between about 6,500 to 3.8 billion light years from Earth.


