
CXC Home | Search | Help | Image Use Policy | Latest Images | Privacy | Accessibility | Glossary | Q&A
Adding Color to Chandra Images

The colors we see in the world around us are the result of the way that the human eye and brain perceive different wavelengths of light in the visible part of the electromagnetic spectrum. X rays, and other wavelengths such as radio, infrared, ultraviolet and gamma-rays, cannot be seen with the human eye, and thus do not have any "color." To see the invisible wavelengths, detectors sensitive those other wavelengths are needed. For more information on the detectors on Chandra, see http://chandra.harvard.edu/about/science_instruments.html
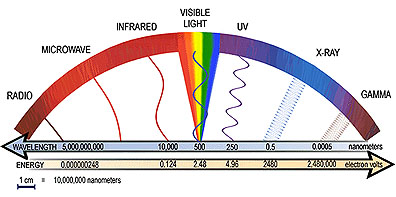
A closer look: The electromagnetic spectrum
Images taken by telescopes that observe at the "invisible" wavelengths are sometimes called "false color images" or "representative color images." That is because the colors used to make them are chosen to bring out important details. The color choice is usually a combination of what works best to show the data, as well as aesthetic choice. The color selection is used as a type of code in which the colors can be associated with the intensity or brightness of the radiation from different regions of the image, or with the energy of the emission.
|
|
|
|
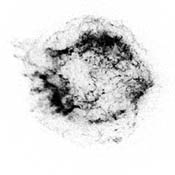
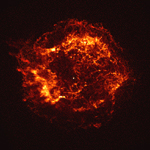
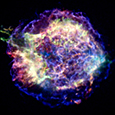
Chandra X-ray images of
Cassiopeia A
|
||
For example, in the black and white Chandra X-ray image of the supernova remnant Cassiopeia A (Cas A) shown on the left, the darker shades represent the most intense X-ray emissions, the lighter shades of gray represent the areas of less intense emission, and the white areas represent the areas of little to no emission. In the yellow and orange version in the middle, a different "color code" was shown. There, the white and yellow colors represent the areas of highest X-ray intensity, the orange to red areas represent the areas of lower intensity, and the black represents little or no emission.
Variations in intensity in an X-ray image are usually associated with variations in the density, or concentration, of hot gas. In this image, the bright regions are associated with shock waves produced by an expanding shell of hot gas.
The version of Cas A on the right shows an image constructed by selecting different X-ray energy bands from the data, and using a color code to represent these. This representation can highlight temperature variations in the gas, with higher temperatures associated with higher energy X-rays, etc. The choices of energy bands and colors are arbitrary, but X-ray astronomers generally follow the convention that the low, medium, and higher X-ray energy bands of the Chandra data are shown as red, green, and blue respectively. In this particular image, red, green and blue represents X-ray energy bands of 0.3 to 1.55 kilovolts, 1.55 to 3.34 kilovolts, and 3.34 to 10 kilovolts, respectively.
Related Resources:Open FITS: Create 3-Color Chandra Images from Raw Data
Creating 3-color images using SAO DS9
Chandra Images by Date:
[ ' 26
| ' 25
| ' 24
| ' 23
| ' 22
| ' 21
| ' 20
| ' 19
| ' 18
| ' 17
| ' 16
| ' 15
| ' 14
| ' 13
| ' 12
| ' 11
| ' 10
| ' 09
| ' 08
| ' 07
| ' 06
| ' 05
| ' 04
| ' 03
| ' 02
| ' 01
| ' 00
| ' 99
]
Revised: August 12, 2013