
(April 9th, 2020: Please see the end of this caption for an added note discussing the possibility of systematic errors.)
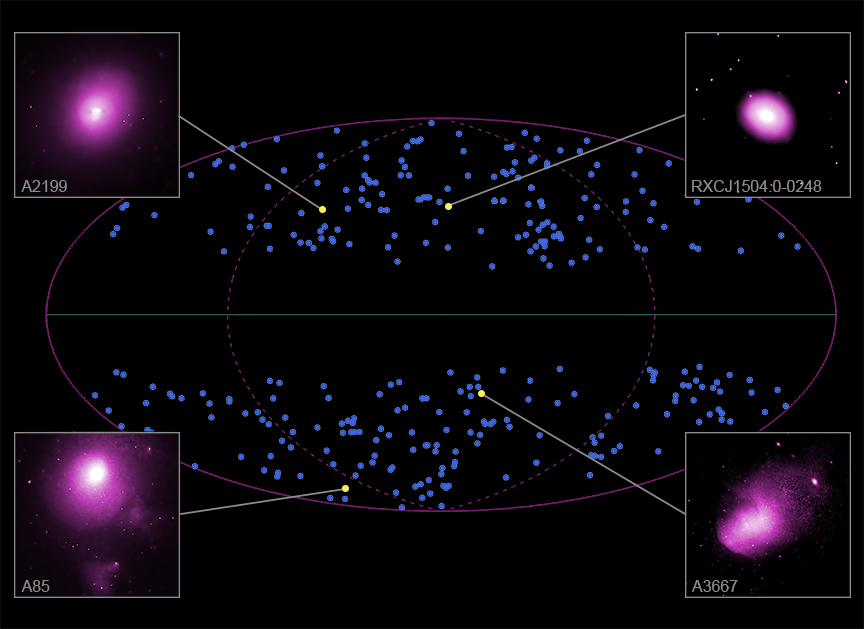
This graphic contains a map of the full sky and shows four of the hundreds of galaxy clusters that were analyzed to test whether the Universe is the same in all directions over large scales, as described in our latest press release. Galaxy clusters are the largest objects in the Universe bound by gravity and astronomers can use them to measure important cosmological properties. This latest study uses data from NASA's Chandra X-ray Observatory and ESA's XMM-Newton to investigate whether or not the Universe is "isotropic."
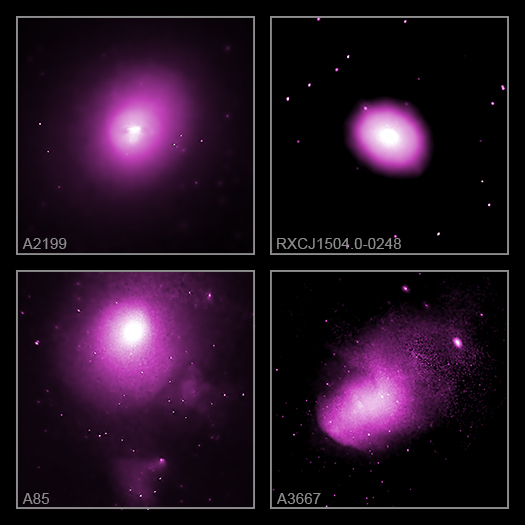
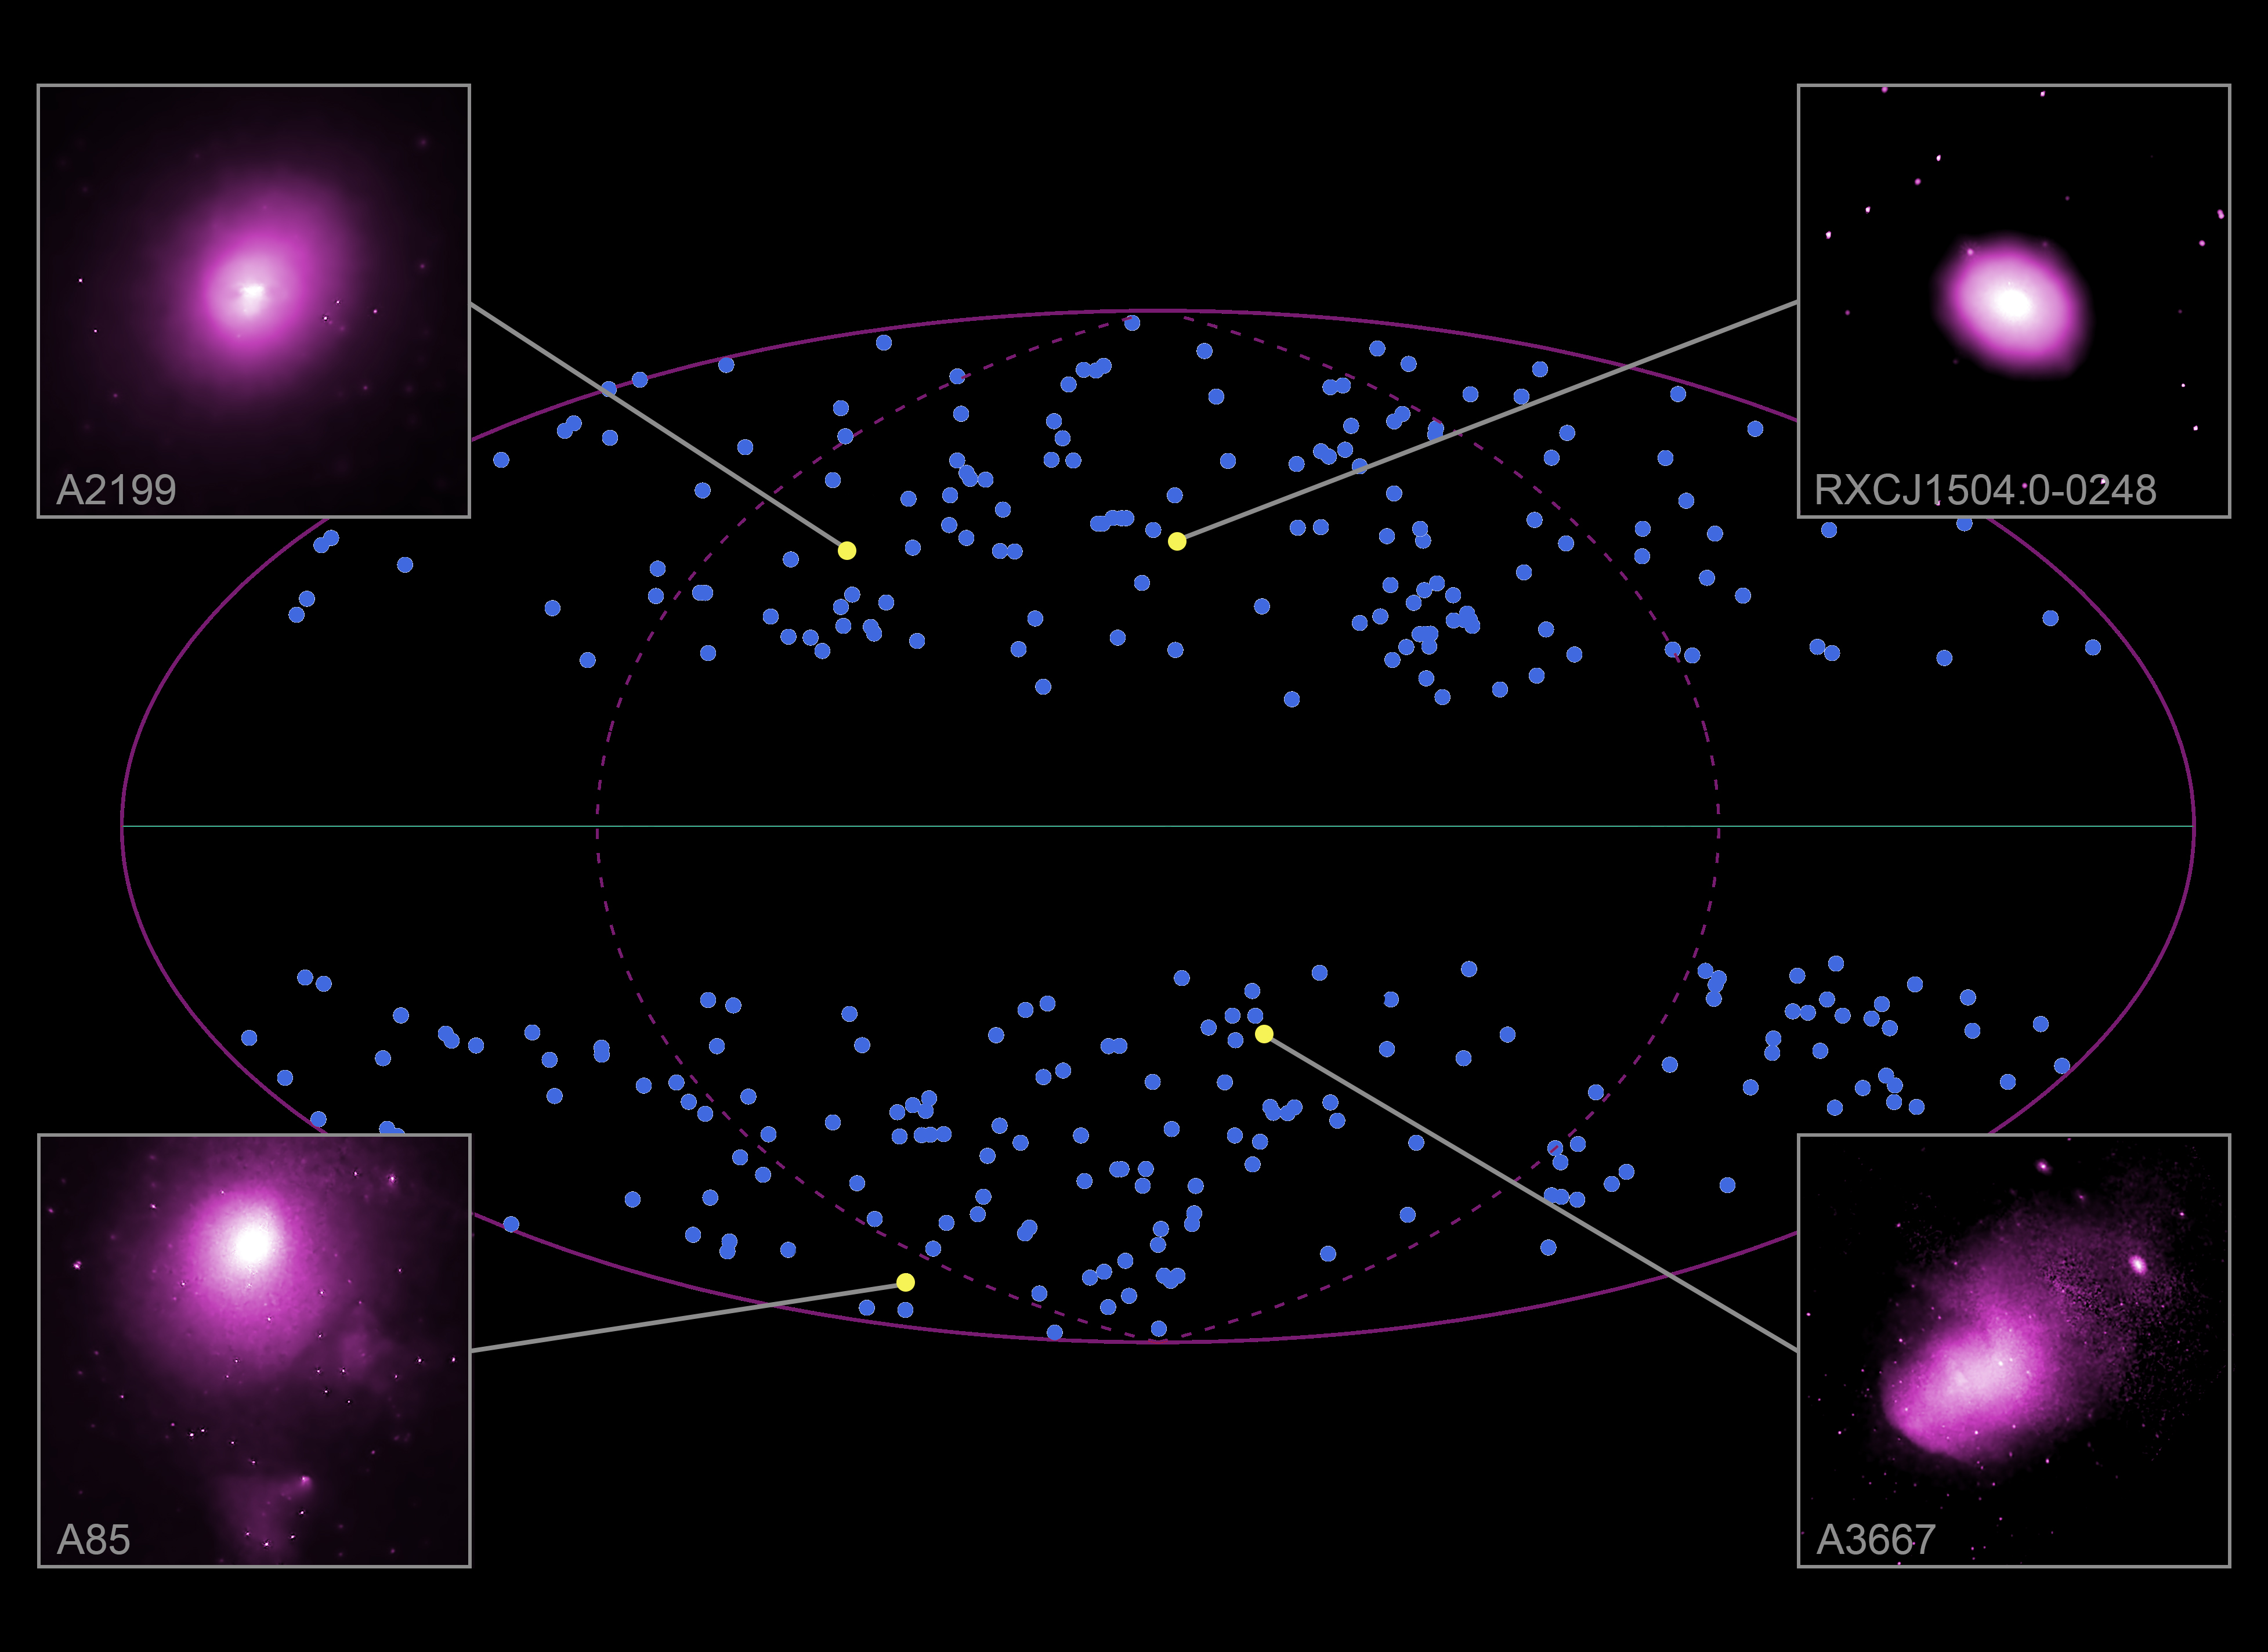
The sky map in this schematic is in "galactic coordinates," with the plane of the Milky Way running along the middle (instead of the equator like is used for Earth). Galactic longitude runs in the horizontal, or "x" direction, and galactic latitude runs in the vertical, or "y" direction. The dark points show the location in the sky map of the 313 galaxy clusters observed with Chandra and XMM-Newton and included in this study. The four Chandra images of galaxy clusters from the new study are, in a clockwise direction from the top left, Abell 2199, RXCJ1504.1-0248, Abell 3667 and Abell 85. Galaxy clusters with galactic latitudes less than 20 degrees were not included in the survey to avoid obscuration from the Galaxy itself, which has most of its stars, gas and dust along a thin plane. Similarly, galaxy clusters behind two nearby galaxies, the Small Magellanic Cloud and the Large Magellanic Cloud, and behind the Virgo galaxy cluster were not included to avoid obscuration.
Astronomers generally agree that after the Big Bang, the cosmos has continuously expanded like a baking loaf of raisin bread. As the bread bakes, the raisins (which represent cosmic objects like galaxies and galaxy clusters) all move away from one another as the entire loaf (representing space) expands. With an even mix the expansion should be uniform in all directions, as it should be with an isotropic Universe.
This latest test uses a powerful, novel and independent technique and suggests the concept of an isotropic Universe may not entirely fit. The study capitalizes on the relationship between the temperature of the hot gas pervading a galaxy cluster and the amount of X-rays it produces, known as the cluster's X-ray luminosity. The higher the temperature of the gas in a cluster, the higher the X-ray luminosity is. Once the temperature of the cluster gas is measured, the X-ray luminosity can be estimated. This method is independent of cosmological quantities, including the expansion speed of the Universe.
Once they estimated the X-ray luminosities of their clusters using this technique, scientists then calculated luminosities using a different method that does depend on cosmological quantities, including the Universe's expansion speed. The results gave the researchers apparent expansion speeds across the whole sky — revealing that the Universe appears to be moving away from us faster in some directions than others.
The authors of this new study came up with two possible explanations for their results that involve cosmology. One of these explanations is that large groups of galaxy clusters might be moving together, but not because of cosmic expansion. For example, it is possible some nearby clusters are being pulled in the same direction by the gravity of groups of other galaxy clusters. If the motion is rapid enough it could lead to errors in estimating the luminosities of the clusters.
A second possible explanation is that the Universe is not actually the same in all directions. One intriguing reason could be that dark energy — the mysterious force that seems to be driving acceleration of the expansion of the Universe — is itself not uniform. In other words, the X-rays may reveal that dark energy is stronger in some parts of the Universe than others, causing different expansion rates.
Either of these two cosmological explanations would have significant consequences. The astronomical community must perform other scrutinized tests obtaining consistent results every time to truly know if the concept of an isotropic Universe should be reconsidered.
A paper describing these results will appear in the April 2020 issue of the journal Astronomy and Astrophysics and is available online. The authors are Konstantinos Migkas (University of Bonn, Germany), Gerrit Schellenberger (Center for Astrophysics | Harvard & Smithsonian), Thomas Reiprich, Florian Pacaud and Miriam Elizabeth Ramos-Ceja (University of Bonn), and Lorenzo Lovisari (CfA).
NASA's Marshall Space Flight Center in Huntsville, Alabama, manages the Chandra program for NASA's Science Mission Directorate in Washington. The Smithsonian Astrophysical Observatory in Cambridge, Massachusetts, controls Chandra's science and flight operations.
Added note (April 9th, 2020): In the original posting of this caption and the press release we did not mention the possibility of "systematic errors" explaining some or all of these results, rather than the two cosmological explanations we discuss. First author Konstantinos Migkas had explained an example of a possible systematic error in his blog post that accompanied the press release. A relevant excerpt is here:
"So did we tear down one of the most crucial pillars of cosmology? Not so fast, it is not that simple. At least two scenarios may have led us to wrong conclusions.
Firstly, cosmic material might interfere with the light that travels from the clusters to the Earth. For example, previously unknown gas and dust clouds beyond the Milky Way could obscure a fraction of photons emitted from the clusters. Since we ignore the possible existence of such clouds, we do not account for their interference, and hence we would falsely underestimate the true luminosity of the clusters. Eventually, we could mistake this for a cosmological effect. We performed several tests that led us to believe that this scenario seems unlikely, but not impossible. However, considering that the direction of the anisotropy we find agrees with other studies that used observations in light at different wavelengths, where such obscuring effects are not expected, one could argue against the possibility of such biases in our analysis."
Their peer reviewed and published paper considers this and several other possible systematic errors in detail, and will address other possibilities in a future peer-reviewed paper.
|
||||||||||||||||||||||||||||||
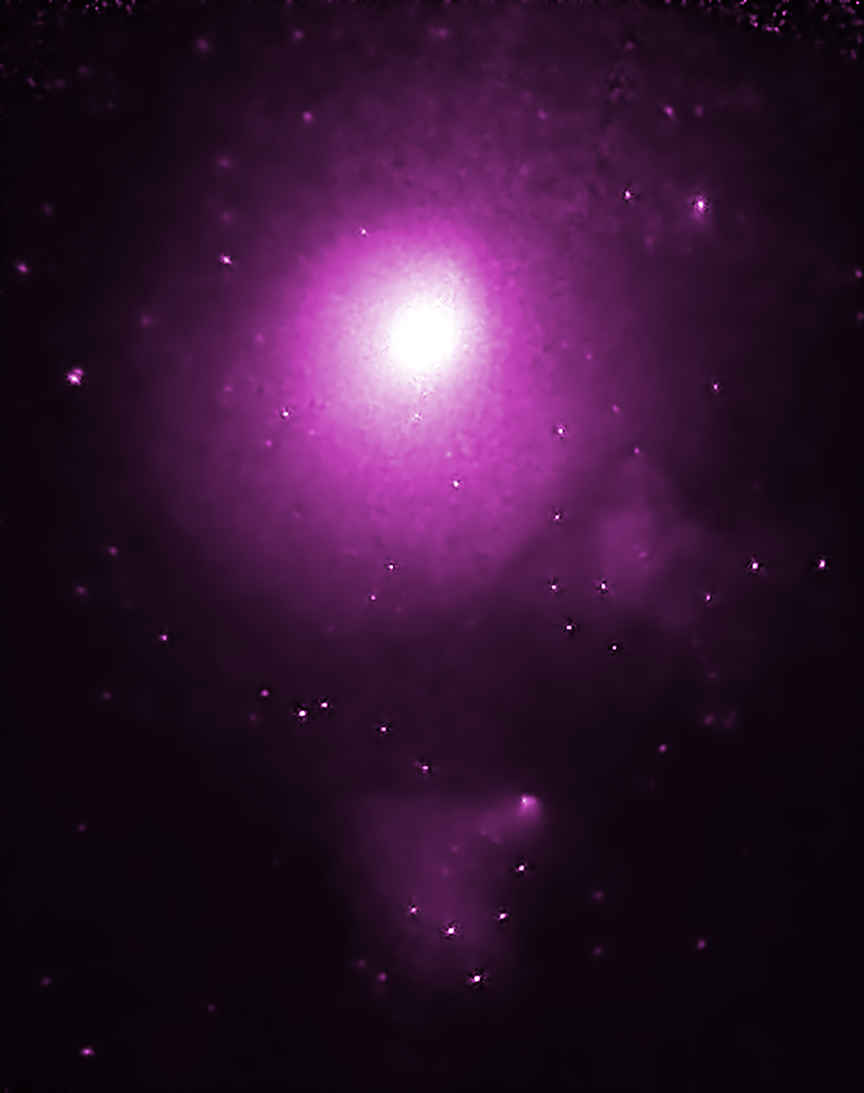
| Fast Facts for Abell 2199: | |
| Credit | NASA/CXC/Univ. of Bonn/K. Migkas et al. |
| Release Date | April 8, 2020 |
| Scale | Image is about 15 arcminutes (1.8 million light years) across. |
| Category | Cosmology/Deep Fields/X-ray Background, Groups & Clusters of Galaxies |
| Coordinates (J2000) | RA 16h 28m 38.50s | Dec 39° 33´ 03" |
| Constellation | hercules |
| Observation Date | 6 pointings between December 1999 through November 2009 |
| Observation Time | 44 hours (1 day 20 hours) |
| Obs. ID | 497-498, 10748, 10803-10805 |
| Instrument | ACIS |
| References | Migkas, K. et al., 2020, A&A; arXiv:2004.03305 |
| Color Code | X-ray: Magenta |
| Distance Estimate | About 410 million Light Years (z=0.030) |
|
||||||||||||||||||||||||||||||
|
||||||||||||||||||||||||||||||
This graphic contains a map of the full sky and highlights four of the hundreds of galaxy clusters. Galaxy clusters are the largest objects in the Universe bound by gravity and astronomers can use them to measure important cosmological properties. The sky map in this schematic is in "galactic coordinates," with the plane of the Milky Way running along the middle (instead of the equator like is used for Earth). Galactic longitude runs in the horizontal, or "x" direction, and galactic latitude runs in the vertical, or "y" direction. The dark points show the location in the sky map of 313 galaxy clusters observed with Chandra and XMM-Newton and included in a study. The four Chandra images of galaxy clusters from the study are shown as pull-outs in each corner colored as purple-pink blobs, in a clockwise direction from the top left, Abell 2199, RXCJ1504.1-0248, Abell 3667 and Abell 85.

