


CXC Home | Search | Help | Image Use Policy | Latest Images | Privacy | Accessibility | Glossary | Q&A
1
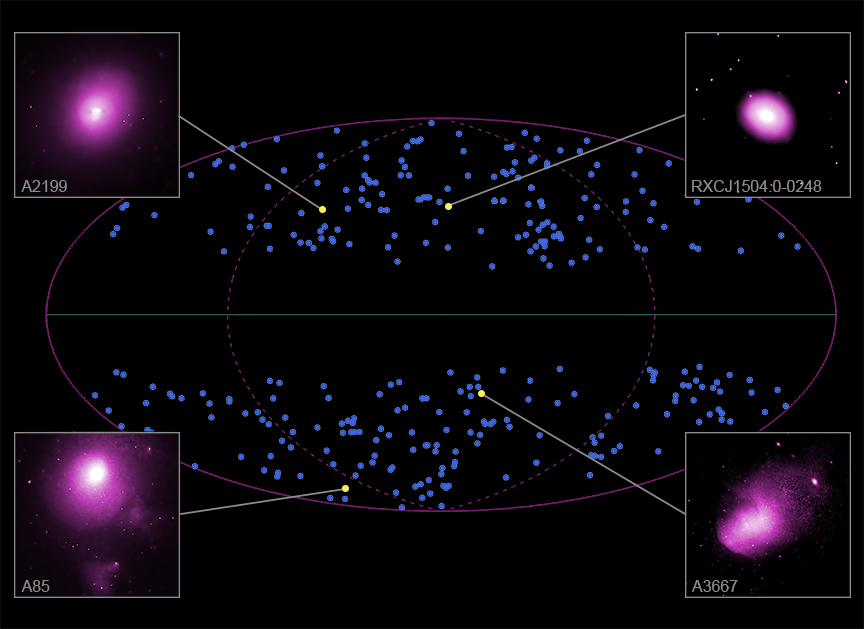
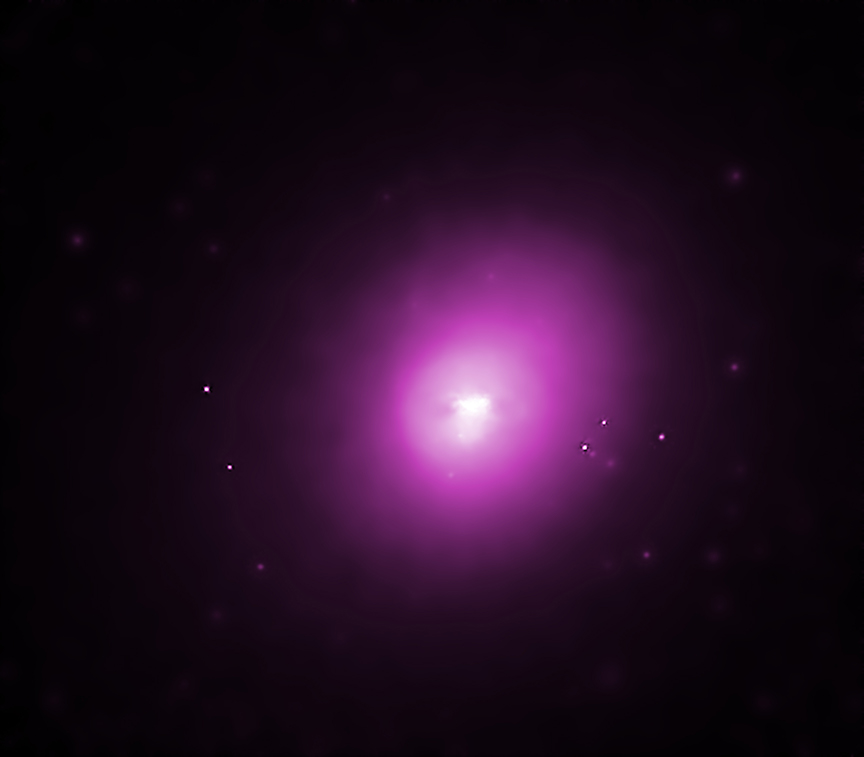
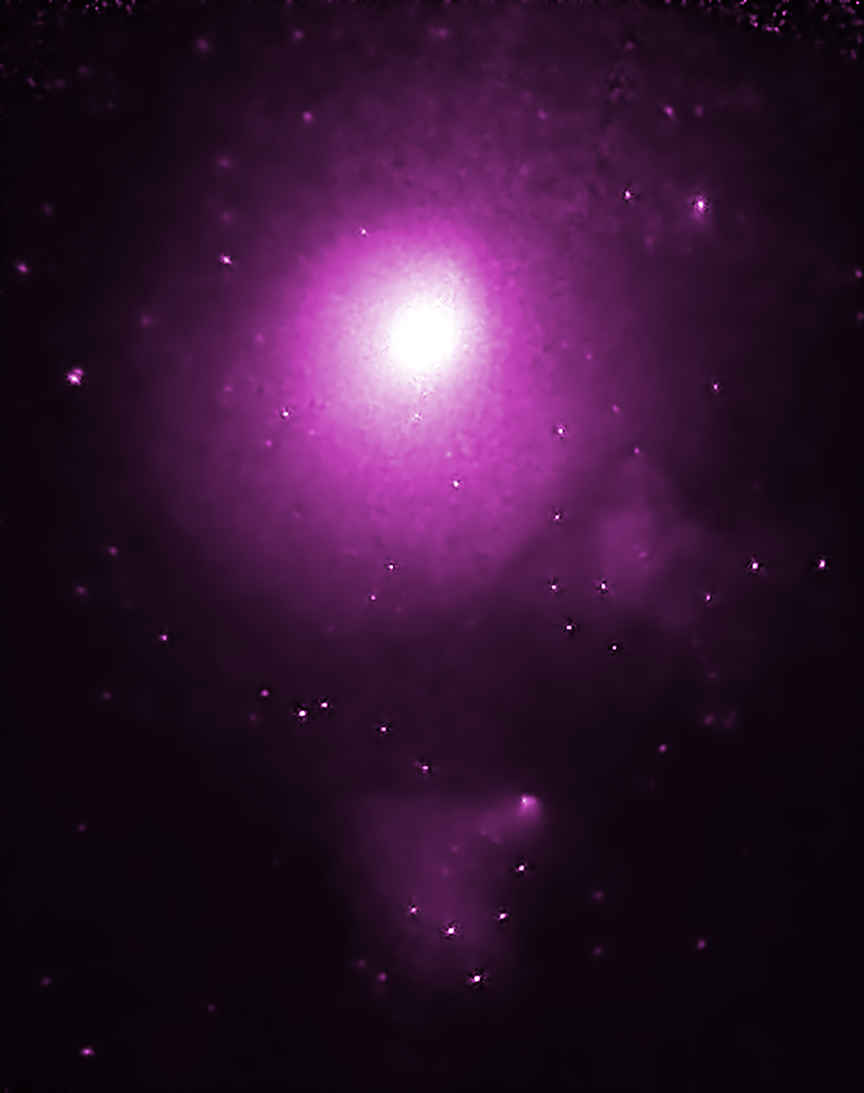
X-ray Images of Abell 2199, RXCJ1504.1-0248, Abell 3667 & Abell 85
These images show a map of the full sky and Chandra images of four galaxy clusters that were analyzed in a large survey to test whether the Universe is the same in all directions over large scales. Galaxy clusters are the largest objects in the Universe bound by gravity and astronomers can use them to measure important cosmological properties. This study, using Chandra and XMM-Newton data, capitalizes on the relationship between the temperature of the hot gas pervading a galaxy cluster and the amount of X-rays it produces. The results suggest the concept of an "isotropic" Universe may not entirely fit.
(Credit: NASA/CXC/Univ. of Bonn/K. Migkas et al.)
2
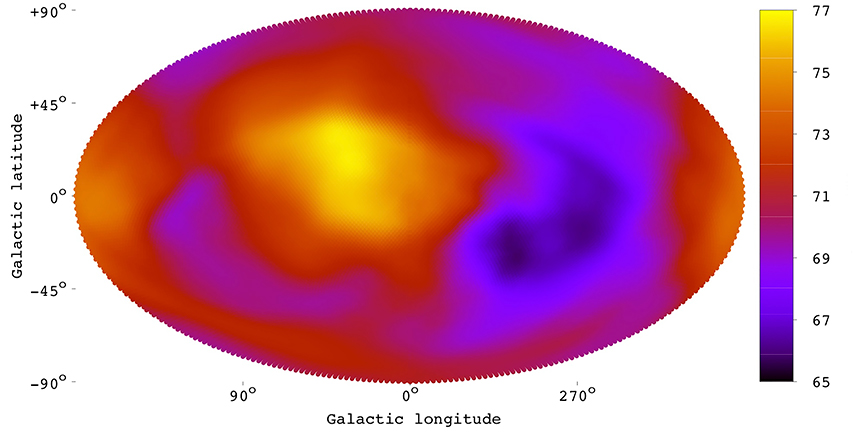
Sky Maps of Universe's Expansion Rate
These graphics show a map of the universe's expansion rates in different directions, estimated in a new study by Konstantinos Migkas and collaborators. The maps are in galactic coordinates, with the center of the graphics looking towards the center of our galaxy. The black and purple colors show the directions of the lowest expansion rates (the Hubble constant) and the yellow and red colors show the directions of the highest expansion rates.
(Credit: University of Bonn/K. Migkas et al.)
Return to: Universe's Expansion May Not Be The Same In All Directions (April 8, 2020)
Revised: November 29, 2022