
Correction: After this paper (Treister et al. 2011) was published and publicized a problem was discovered with the background subtraction used. Analysis by several groups, including the Treister et al. team, plus Willott (2011) and Cowie et al. (2012), shows that a significant detection of AGN (growing black holes) in the early universe can no longer be claimed.
Editor's Note: Honest errors such as this are part of the scientific process, especially on the frontiers of discovery. To quote Nobel laureate Frank Wilczek, "If you don't make mistakes, you're not working on hard enough problems. And that's a big mistake."
References:
Cowie, L. et al. 2012, ApJ, in press
https://arxiv.org/abs/1110.3326
Treister, E. et al. 2011, Nature, 474, 356
https://arxiv.org/abs/1106.3079
Willott, C. 2011, ApJ, 742, L8
https://arxiv.org/abs/1110.4118
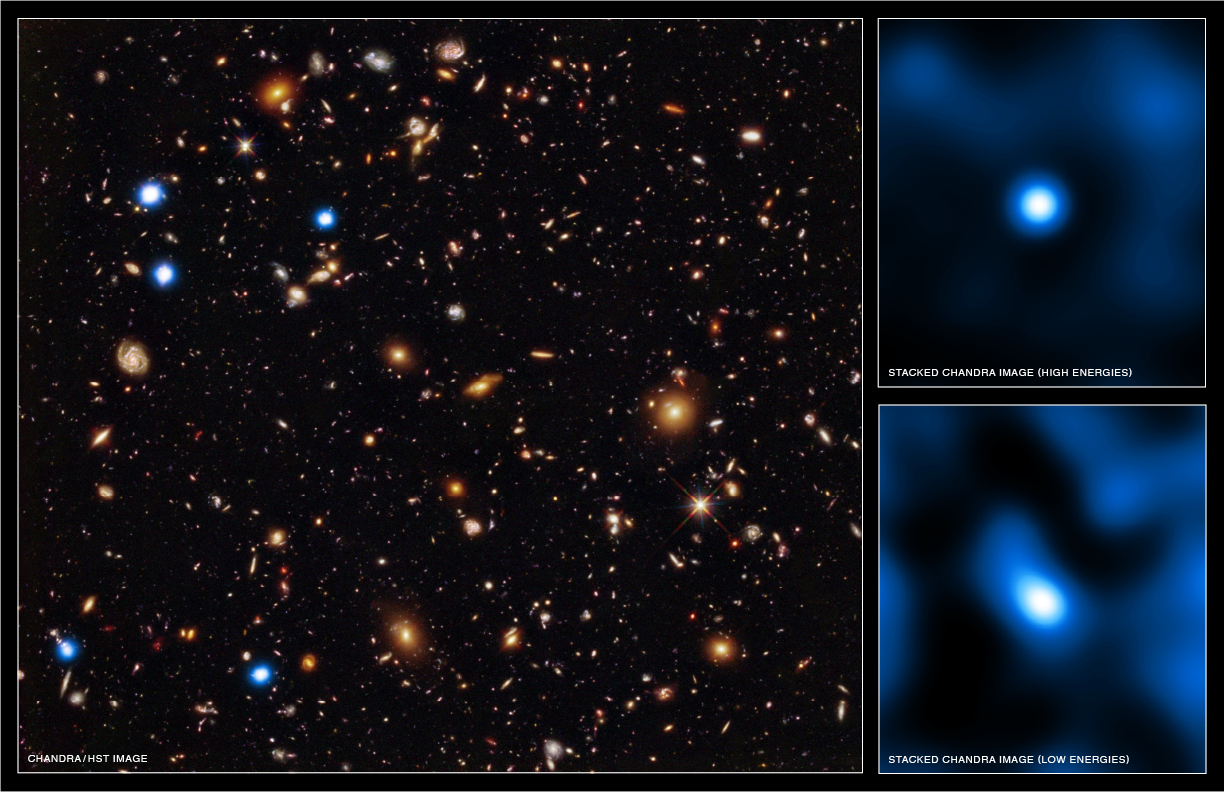
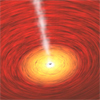
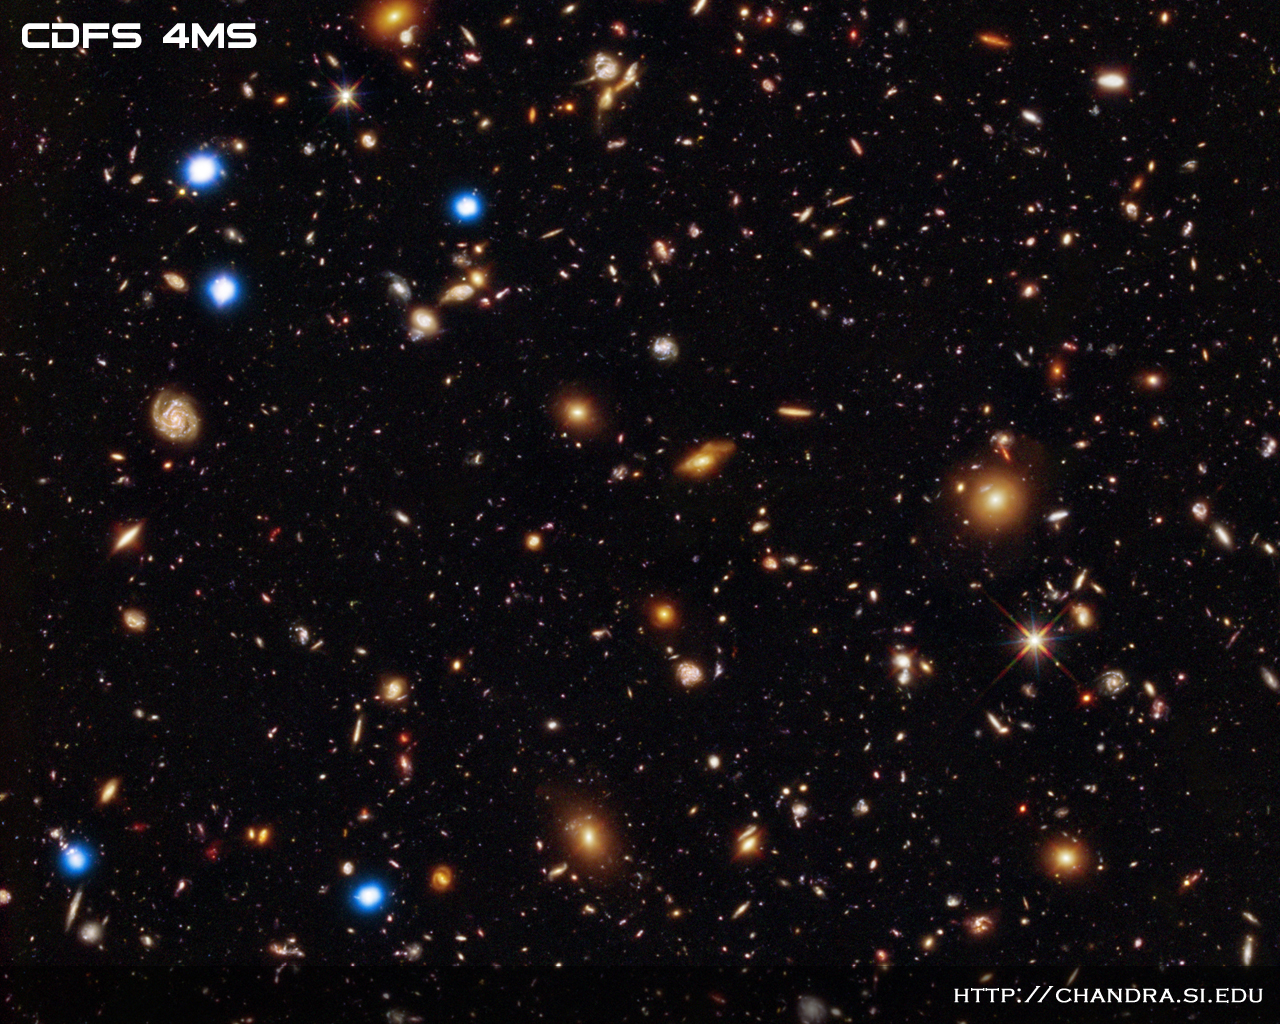
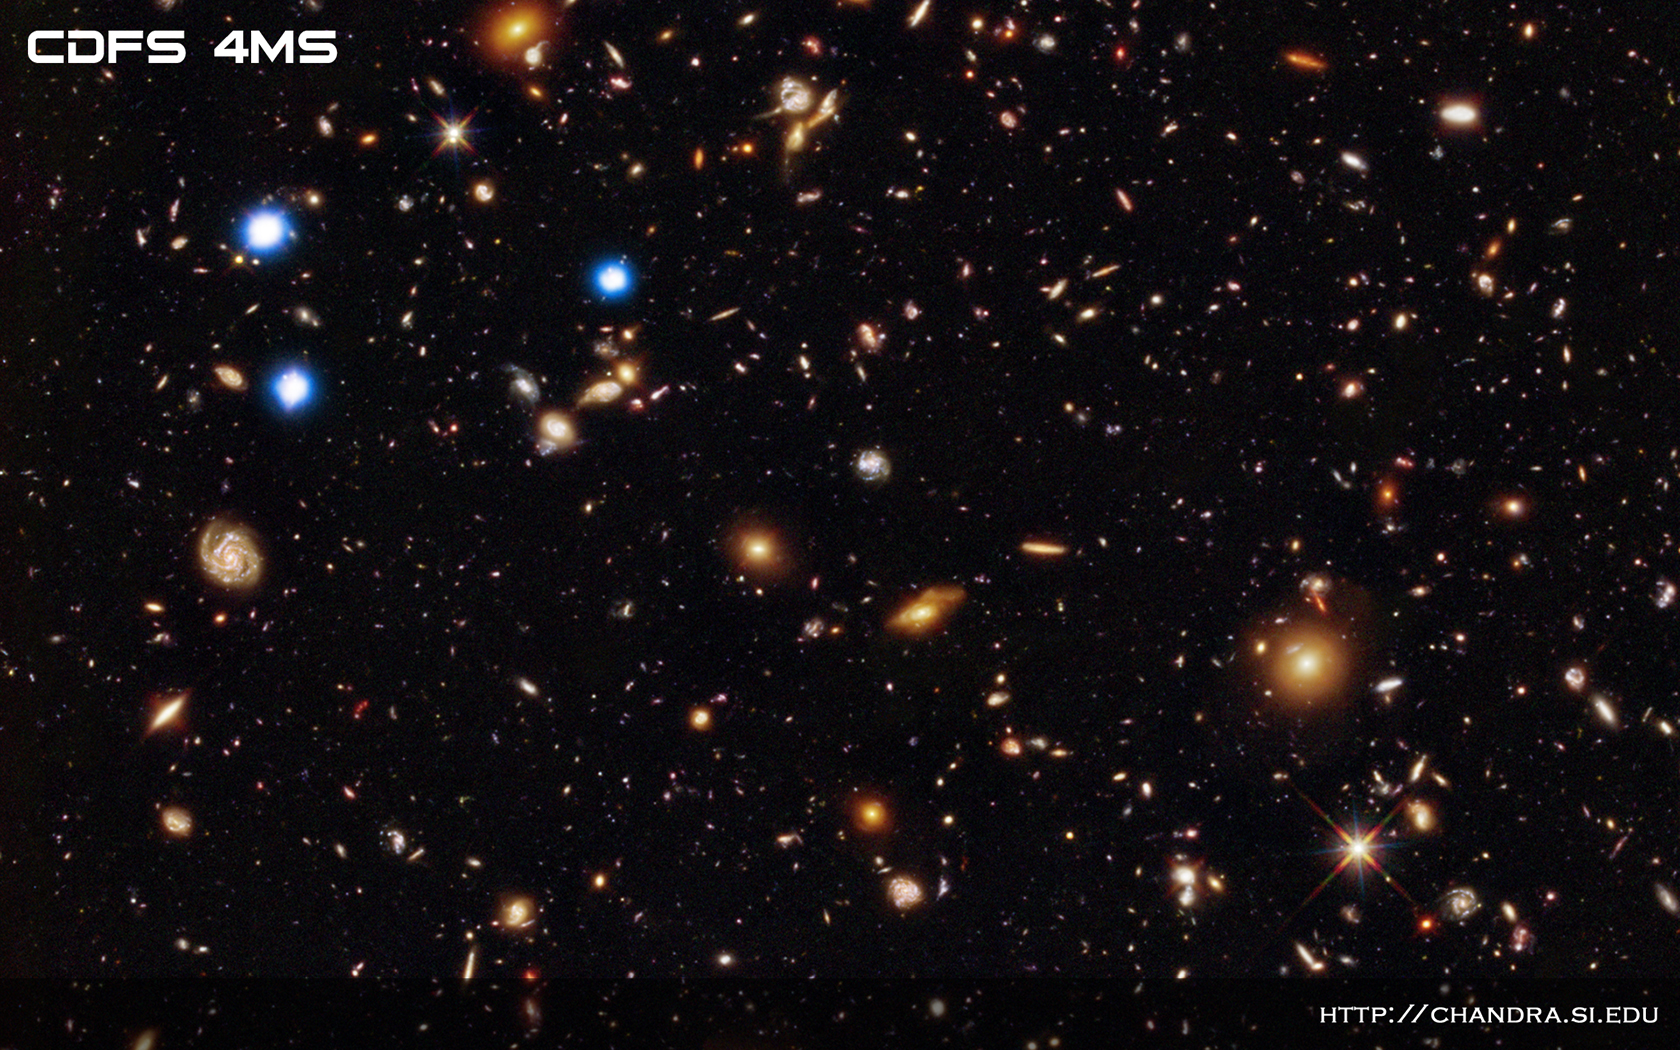
This composite image from NASA's Chandra X-ray Observatory and Hubble Space Telescope (HST) combines the deepest X-ray, optical and infrared views of the sky. Using these images, astronomers have obtained the first direct evidence that black holes are common in the early Universe and shown that very young black holes grew more aggressively than previously thought.
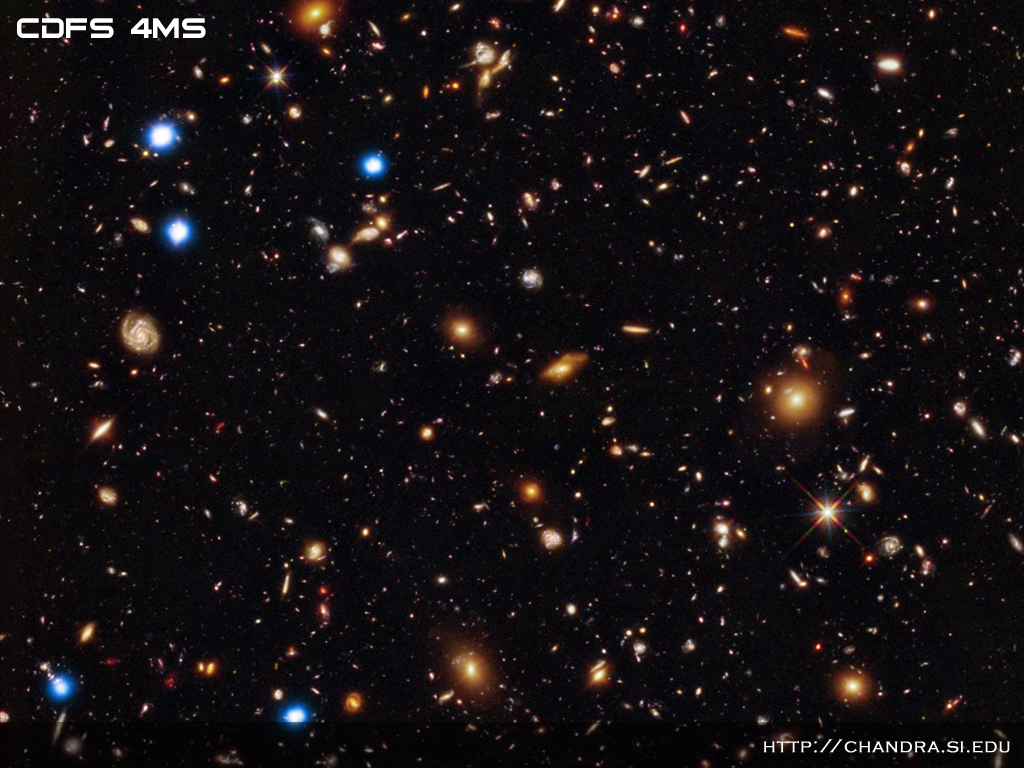
Astronomers obtained what is known as the Chandra Deep Field South (CDFS) by pointing the telescope at the same patch of sky for over six weeks of time. The composite image shows a small section of the CDFS, where the Chandra sources are blue, the optical HST data are shown in green and blue, and the infrared data from Hubble are in red and green.
The new Chandra data allowed astronomers to search for black holes in 200 distant galaxies, from when the Universe was between about 800 million and 950 million years old. These distant galaxies were detected using the HST data and the positions of a subset of them are marked with the yellow circles (roll your mouse over the image above).
The rest of the 200 galaxies were found in other deep HST observations located either elsewhere in the CDFS or the Chandra Deep Field North, a second ultra- deep Chandra field in a different part of the sky.
None of the galaxies was individually detected with Chandra, so the team used a technique that relied on Chandra's ability to very accurately determine the direction from which the X-rays came to add up all the X-ray counts near the positions of these distant galaxies. The two "stacked" images resulting from this analysis are on the right side of the graphic, where the bottom image shows the low-energy X- rays and the top image has the high-energy X-rays. Statistically significant signals are found in both images.
These results imply that between 30% and 100% of the distant galaxies contain growing supermassive black holes. Extrapolating these results from the relatively small field of view that was observed to the full sky, there are at least 30 million supermassive black holes in the early Universe. This is a factor of 10,000 larger than the estimated number of quasars in the early Universe.

The stronger signal in high-energy X-rays implies that the black holes are nearly all enshrouded in thick clouds of gas and dust. Although copious amounts of optical light are generated by material falling onto the black holes, this light is blocked within the core of the black hole's host galaxy and is undetectable by optical telescopes. However, the high energies of X-ray light can penetrate these veils, allowing the black holes inside to be studied.
This 3-panel image of the Chandra Deep Field South features various shades of blue and gold with white, all on a black background. The left image is dominated by a large number of small gold sources, mostly galaxies and other objects in the field, and a small number of larger blue sources. This composite image from NASA's Chandra X-ray Observatory and Hubble Space Telescope combines the deepest X-ray, optical and infrared views of the sky. The Chandra Deep Field South was made by pointing the telescope at the same patch of sky for over six weeks of time. In many cases no Chandra sources were detected at the positions of galaxies seen in Hubble data. On the right of the image are two views where the X-ray counts from these locations were stacked on top of one another, to see if a signal emerged in high energy (top) and low energy X-rays (bottom). This procedure was not performed correctly, and implied the presence of signals that do not exist in the data.
|
||||||||||||||||||||||||||||||

| Share This |
|

