

CXC Home | Search | Help | Image Use Policy | Latest Images | Privacy | Accessibility | Glossary | Q&A
1
3-D Visualization of Cassiopeia A
A research team has released a unique look of the supernova remnant Cassiopeia A (Cas A). By combining data from Chandra, the Spitzer Space Telescope, and ground- based optical observations, astronomers have been able to construct the first three-dimensional fly-through of a supernova remnant. This visualization (shown here as a still image) was made possible by importing the data into a medical imaging program that has been adapted for astronomical use. Commercial software was then used to create the version of the 3-D data. The green region shown in the image is mostly iron observed in X-rays; the yellow region is mostly argon and silicon seen in X-rays, optical and infrared and the red region is cooler debris seen in the infrared. The positions of these points in three-dimensional space were found by using the Doppler effect and simple assumptions about the supernova explosion. View Movie
(Credit: NASA/CXC/MIT/T.Delaney et al.)
2
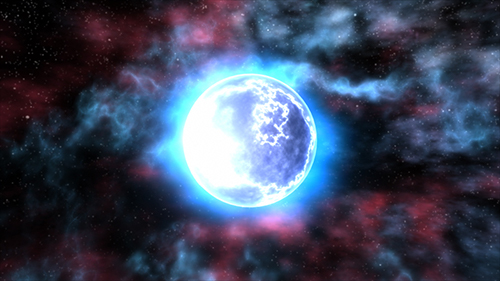
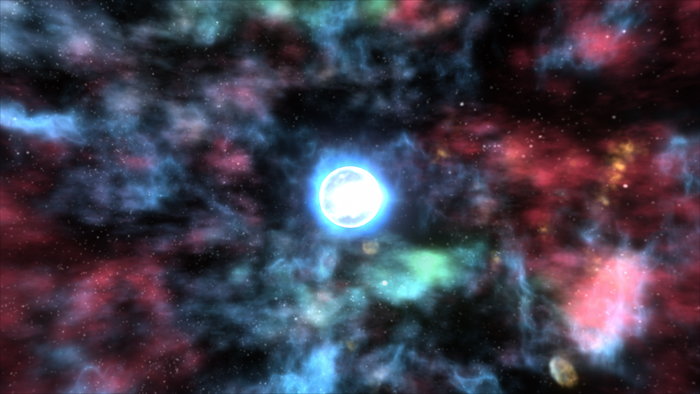
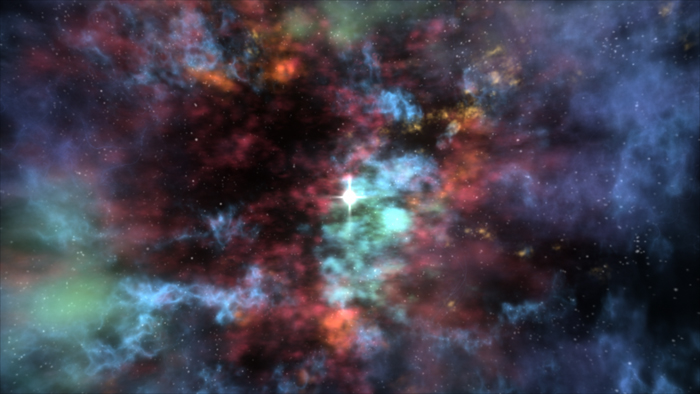
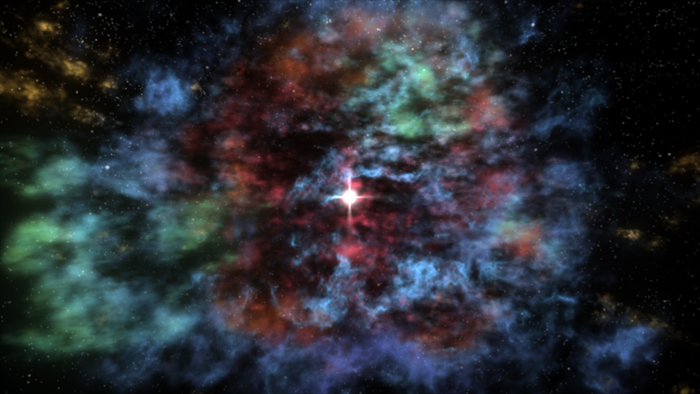
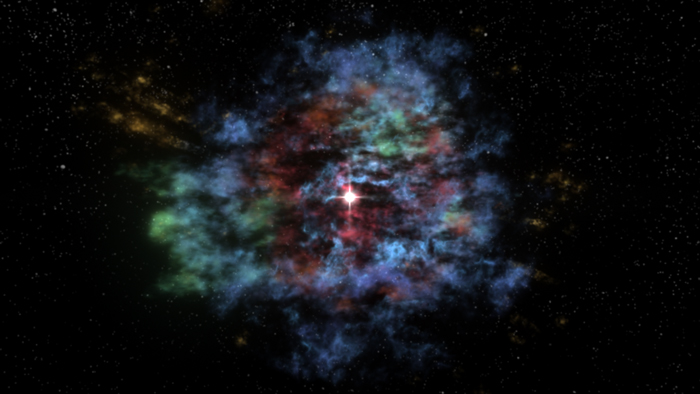
Still Illustrations of Cassiopeia A
This series of still illustrations depicts a fly-through of Cas A based on the 3-D representation constructed from Chandra and Spitzer data. New features unseen in traditional 2-D data sets are visible, including details of how the parent star exploded. The green region is mostly iron observed in X-rays; the yellow region is mostly argon and silicon seen in X-rays, optical and infrared; the red region is cooler debris seen in the infrared and the blue region is the outer blast wave, most prominent in X-rays. View Movie
Credit: Visualization: NASA/CXC/D.Berry; Model: NASA/CXC/MIT/T.Delaney et al.
Return to Cassiopeia A (January 6, 2009)
Revised: November 30, 2022