Chandra Discovery Solves Solar Paradox
Sometimes you have to leave home to really appreciate it. A pair of scientists tried a variation on this theme when they used Chandra observations of stars hundreds of light years from Earth to better understand the Sun, which is a mere 8 light minutes (93 million miles) away.
The problem was the vexing question as to how much neon the Sun contains. This seemingly esoteric bit of knowledge turns out to be important to scientists seeking to understand how the Sun works. And the Sun, as the nearest star and a fairly average star, is an obvious starting point toward understanding how most of the other stars in the Universe work.
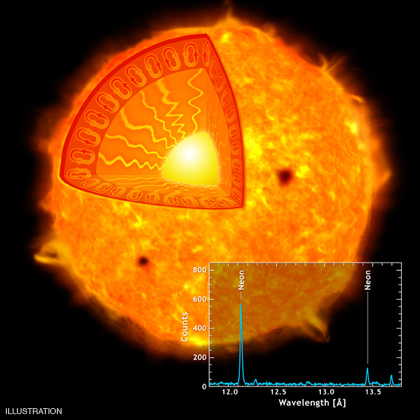
Neon, along with atoms of carbon, nitrogen and oxygen, plays an important role in regulating the rate at which energy flows from nuclear reactions in the Sun's core to its surface. The character of the energy flow changes dramatically about 125,000 miles from the surface on the Sun, where the stately diffusion of heat suddenly converts to a convective motion much like the unstable air in a thunderstorm (see illustration).
The location of this turbulent region, called the convection zone, has been deduced to fairly high precision from the study of oscillations of the surface of the Sun (a technique called helioseismology in analogy of the use of oscillations of the Earth to study its interior). The location of the convection zone can also be deduced to equal precision from theoretical calculations based on among other things, the abundance of neon.
This is where astrophysicists get heartburn. The two determinations disagree. Several scientists have proposed that the paradox could be resolved if the solar abundance of neon is in fact about three times larger than the currently accepted value. This value is based on indirect estimates, since gas at the relatively cool 6,000 degree Celsius surface temperature of the Sun gives off no characteristic radiation at optical wavelengths.
However, a gas heated to millions of degrees produces a distinct neon signal in X-rays. The upper atmospheres, or coronas, of stars like the Sun have temperatures of millions of degrees, so the solar corona would seem to be a good place to settle the argument (not with Chandra -- the bright solar radiation would irreparably damage the telescope).
Unfortunately, the solar X-rays come from numerous localized loops of hot gas that vary from location to location and time to time, complicating the interpretation of the data on neon. Jeremy Drake of the Harvard-Smithsonian Center for Astrophysics in Cambridge, MA and his colleague Paola Testa of the Massachusetts Institute of Technology in Cambridge, came up with an ingenious approach to the problem. They used Chandra to measure the neon abundance in 21 Sun-like stars within a distance of 400 light years (see, e.g. the spectrum of II Pegasi in the inset).
The relative amount of neon in these stars was, on average, almost three times more neon than is measured for the Sun, just the amount needed to bring the solar oscillation observations and the theoretical model into agreement. So, for the moment, astrophysicists can feel that their model of the Sun may be okay after all, and they can continue to boldly extrapolate this understanding to the rest of the Universe.
|
||||||||||||||||||||
In this graphic, an Chandra X-ray Observatory spectrum (that is, a plot of energy versus different wavelengths) is set atop an illustration that features the star II Pegasi. The illustration shows a bright Sun-like star on a black background, and a cut out of the Sun-like star shows its interior structure and convection lines near the rim. At bottom right the Chandra spectrum shows two main blue-green peaks. Chandra measurements of the amount of neon in II Pegasi and 20 other nearby Sun-like stars may provide a better understanding of our nearest star, the Sun. The neon abundances in the outer atmospheres, or coronas, of the 21 stars are remarkably similar, and almost three times larger than estimates of solar abundances. Neon plays an important role in regulating the rate at which energy flows from the center to the surface of the Sun. If the observed larger abundance of neon applies to the Sun, theoretical models for its interior structure can be brought back into agreement with the observations.


