


CXC Home | Search | Help | Image Use Policy | Latest Images | Privacy | Accessibility | Glossary | Q&A
and Dark Energy Concepts
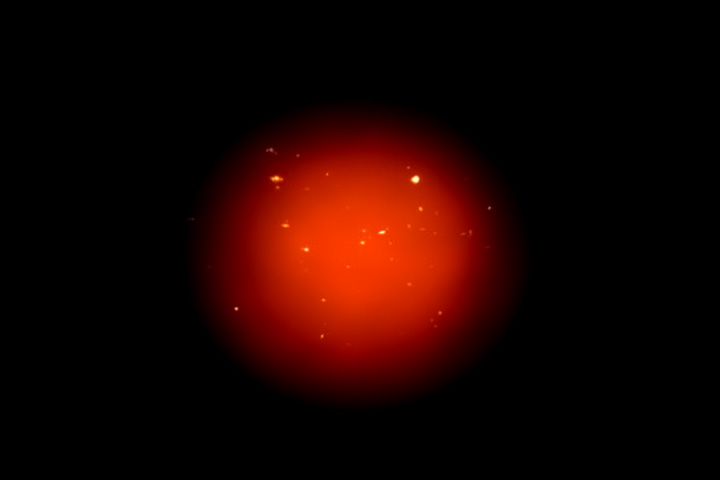
1
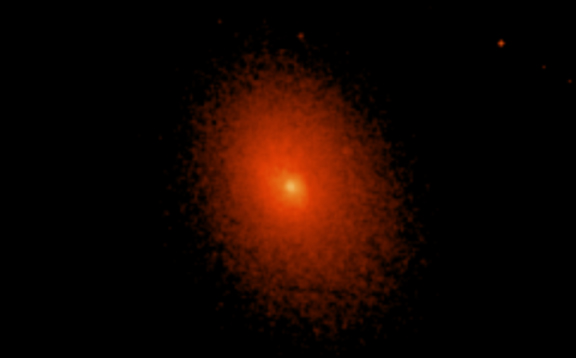
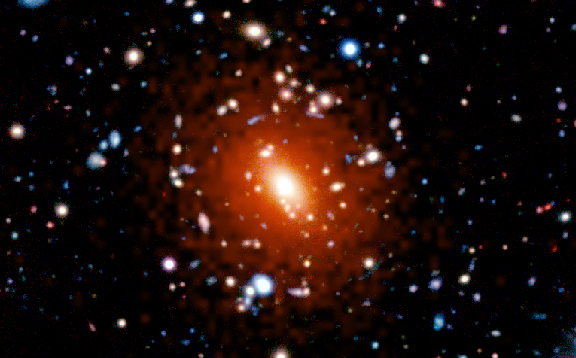
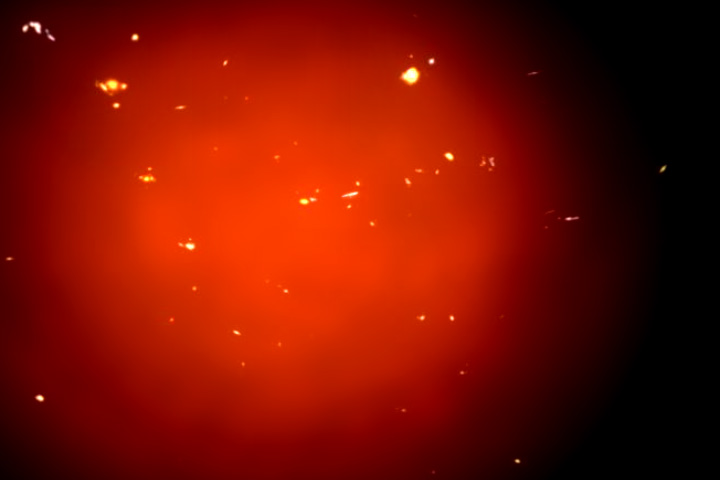
Chandra X-ray Image of Abell 2029
This Chandra image is a galaxy cluster from the latest study of dark energy (from a total of 26 clusters in the sample). Abell 2029's distance corresponds to a light travel time of 1 billion years. The red diffuse emission shows hot intergalactic gas, heated to about 100 million degrees by the enormous gravity in the cluster, and visible only in X-rays. The distances to the clusters in the sample can be derived from the Chandra observations by calculating the relative amounts of hot gas and dark matter. These distances show that the expansion of the Universe began accelerating about six billion years ago.
Scale: Image is 8 x 5 arcmin
(Credit: NASA/CXC/IoA/S.Allen et al.)
More Information on Abell 2029
2
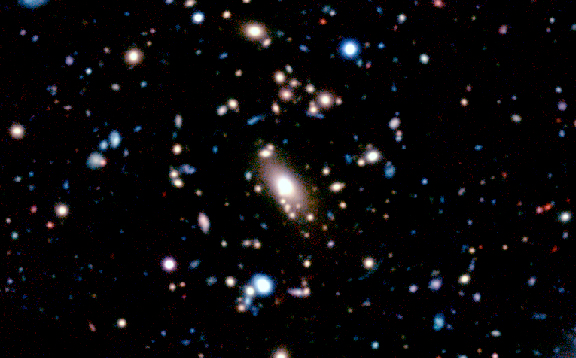
Optical Image of Abell 2029
This optical image from the Kitt Peak 0.9m telescope shows Abell 2029, a cluster of galaxies. A large elliptical galaxy is visible in the center of the image, surrounded by smaller galaxies. This galaxy cluster has a redshift of 0.078, at a distance corresponding to a light travel time of one billion years.
Scale: Image is 8 x 5 arcmin
(Credit: NOAO/Kitt Peak/J.Uson, D.Dale, S.Boughn, J.Kuhn)
3
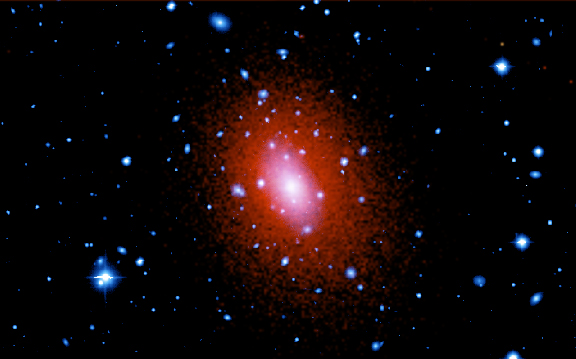
X-ray/Optical Composite of Abell 2029
This optical (blue) and x-ray (red-orange) composite image shows Abell 2029, a cluster of galaxies. A large elliptical galaxy is visible in the center of the image, surrounded by smaller galaxies. The red diffuse emission shows hot intergalactic gas, heated to about 100 million degrees by the enormous gravity in the cluster, and visible only in X-rays. This galaxy cluster has a redshift of 0.078, at a distance corresponding to a light travel time of one billion years.
Scale: Image is 8 x 5 arcmin
(Credit: Optical: NOAO/Kitt Peak/J.Uson, D.Dale; X-ray: NASA/CXC/IoA/S.Allen et al.)
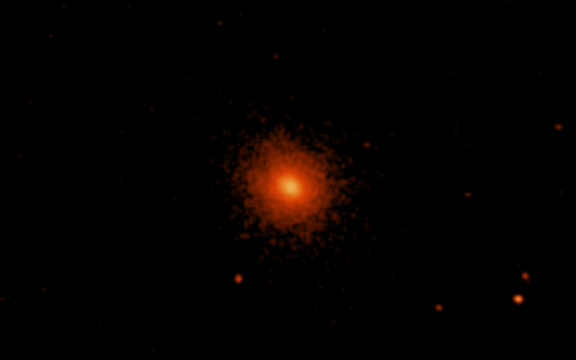
4
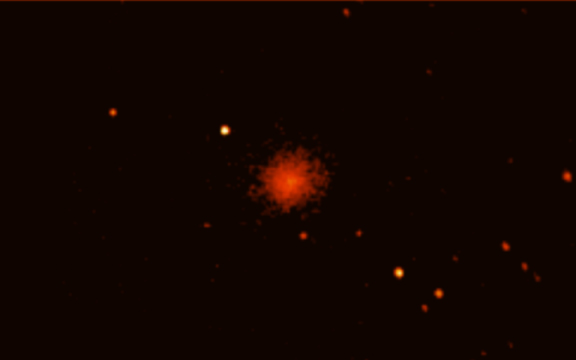
Chandra X-ray Image of MS2137.3-2353
This Chandra image is a galaxy cluster from the latest study of dark energy (from a total of 26 clusters in the sample). MS2137's distance corresponds to a light travel time of 3.6 billion years. The red diffuse emission shows hot intergalactic gas, heated to about 100 million degrees by the enormous gravity in the cluster, and visible only in X-rays. The distances to the clusters in the sample can be derived from the Chandra observations by calculating the relative amounts of hot gas and dark matter. These distances show that the expansion of the Universe began accelerating about six billion years ago.
Scale: Image is 8 x 5 arcmin
(Credit: NASA/CXC/IoA/S.Allen et al.)
More Information on MS2137.3-2353
5
Chandra X-ray Image of MACSJ1423.8+2404
The Chandra X-ray image of the galaxy cluster MACSJ1423 shows hot gas displayed in red. The mass of the hot gas is about 6 times greater than the mass of all the billions of stars in all of the galaxies in the cluster. This galaxy cluster has a redshift of 0.54, at a distance corresponding to a light travel time of 5.4 billion years.
Scale: Image is 8 x 5 arcmin
(Credit: NASA/CXC/IoA/S.Allen et al.)
View Animation of MACSJ1423.8+2404
6
Optical Image of MACSJ1423.8+2404
This image of the galaxy cluster MACSJ1423 is a 3-color optical image from the Subaru prime focus camera. It shows white and blue galaxies centered around a large elliptical galaxy. The mass of the hot gas is about 6 times greater than the mass of all the billions of stars in all of the galaxies in the cluster. This galaxy cluster has a redshift of 0.54, at a distance corresponding to a light travel time of 5.4 billion years.
Scale: Image is 2.56 x 1.6 arcmin
(Credit: NAOJ/Subaru/H.Ebeling)
View Animation of MACSJ1423.8+2404
7
X-ray/Optical Composite of MACSJ1423.8+2404
This composite image shows views of the galaxy cluster MACSJ1423, using optical and X-ray telescopes. The optical image, a 3-color composite from the Subaru prime focus camera, shows white and blue galaxies centered around a large elliptical galaxy. The Chandra X-ray image shows hot gas displayed in red. The mass of the hot gas is about 6 times greater than the mass of all the billions of stars in all of the galaxies in the cluster. This galaxy cluster have a redshift of 0.54, at a distance corresponding to a light travel time of 5.4 billion years.
Scale: Image is 2.56 x 1.6 arcmin
(Credit: Optical: NAOJ/Subaru/H. Ebeling; X-Ray: NASA/CXC/IoA/S.Allen et al.)
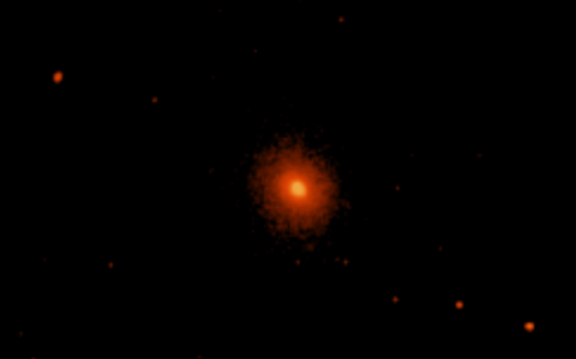
8
Chandra X-ray Image of MS1137.5+6625
This Chandra image is a galaxy cluster from the latest study of dark energy (from a total of 26 clusters in the sample). MS1137's distance corresponds to a light travel time of 7.9 billion years. The red diffuse emission shows hot intergalactic gas, heated to about 100 million degrees by the enormous gravity in the cluster, and visible only in X-rays. The distances to the clusters in the sample can be derived from the Chandra observations by calculating the relative amounts of hot gas and dark matter. These distances show that the expansion of the Universe began accelerating about six billion years ago.
Scale: Image is 8 x 5 arcmin
(Credit: NASA/CXC/IoA/S.Allen et al.)
9
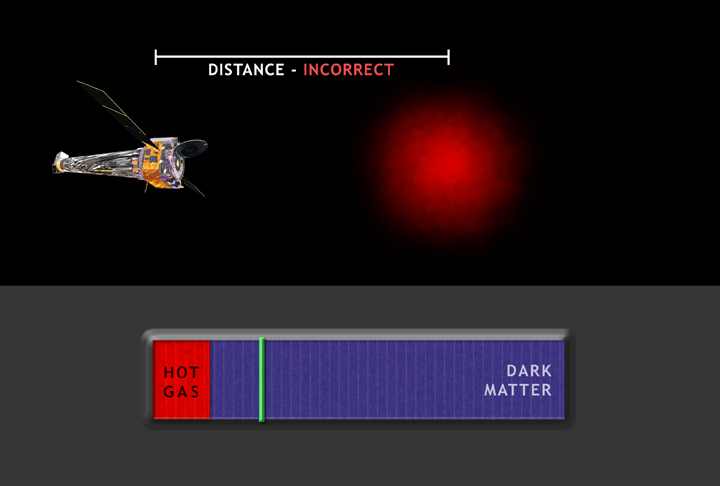
X-ray Distance Measurement Technique
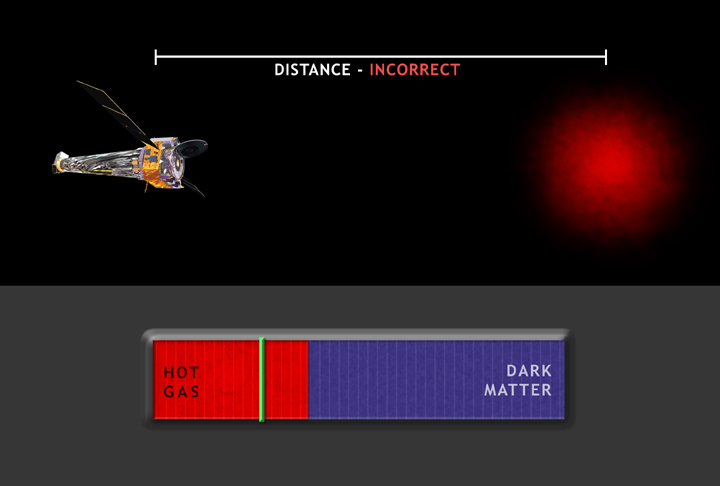
This set of illustrations shows the technique used to make distance measurements to galaxy clusters. Chandra's observations are used to determine the ratio of the mass of the hot gas and the mass of the dark matter in different galaxy clusters. This "gas fraction" depends on the assumed distances to the clusters, which in turn depends on the amount of matter and dark energy in the Universe. Because galaxy clusters are extremely large, the gas fraction should be the same for every cluster, and so the distances to the clusters are adjusted to satisfy this requirement. Each of these 3 illustration shows Chandra in the top left, observing a galaxy cluster, shown in the top right (in red). The relative amounts of hot gas (in red) and dark matter (in blue) are shown at the bottom, with the green marker giving the expected, correct amount. The first illustration shows a gas fraction that is too small, implying that the distance to the cluster is too small, the second shows the correct gas fraction and distance, and the third illustration shows a gas fraction and distance that are too large.
(Credit: NASA/CXC/M.Weiss)
View X-ray Distance Measurement Technique animation
10
Energy Distribution of the Universe
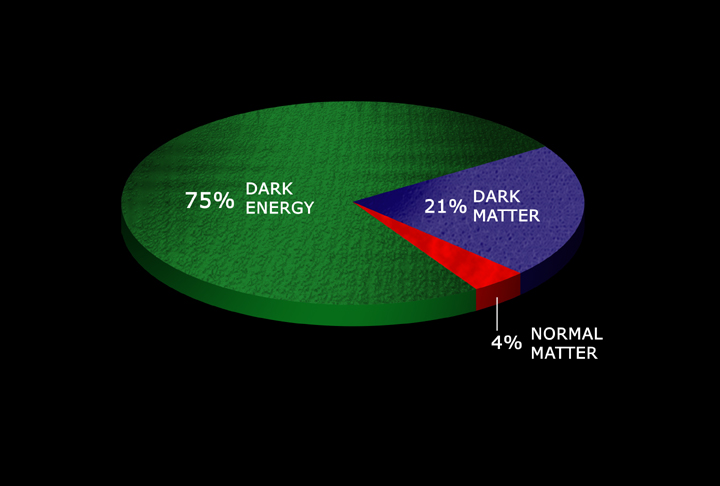
The new Chandra observations include estimates of the total energy content of the Universe. As shown in this illustration, dark energy is estimated to contribute about 75% of the energy in the Universe, dark matter about 21% and normal matter about 4%. Only the normal matter can be directly detected with telescopes, and about 85% of this is hot, intergalactic gas, as detected in Chandra observations of galaxy clusters.
(Credit: NASA/CXC/M.Weiss)
11
Three Possible Futures for the Universe
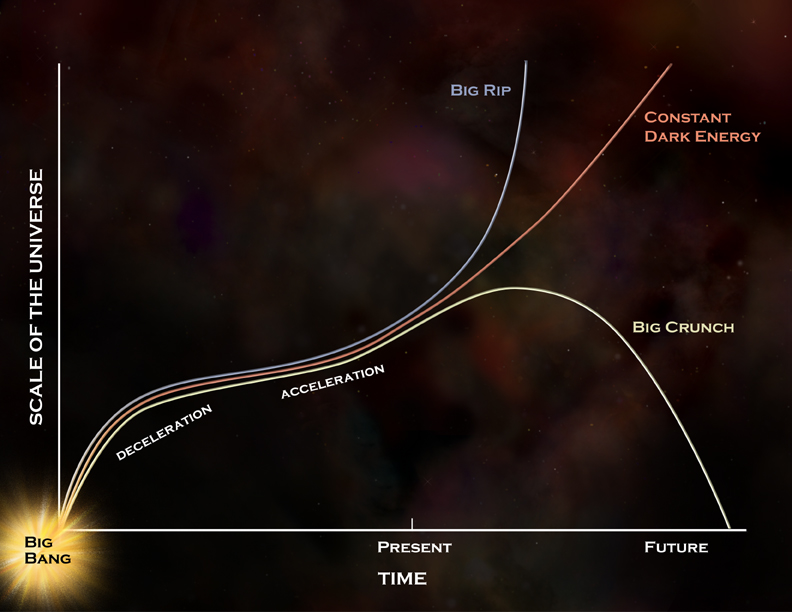
This illustration shows three possible futures for the Universe, depending on the behavior of dark energy, by showing how the scale of the Universe may change with time. If dark energy is constant, as the new Chandra results suggest, the expansion should continue accelerating forever. If dark energy increases, the acceleration may happen so quickly that galaxies, stars, and eventually atoms will be torn apart, in the so-called Big Rip. Dark energy may also lead to a recollapse of the Universe, in the Big Crunch. The illustration also shows the early decelerating expansion of the Universe, followed by the accelerating phase that started about 6 billion years ago.
(Credit: NASA/CXC/M.Weiss)
12
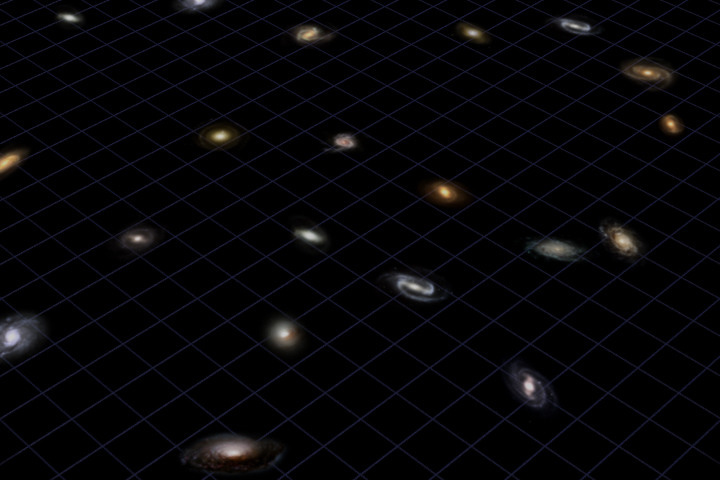
Animation Stills: Effects of Dark Energy
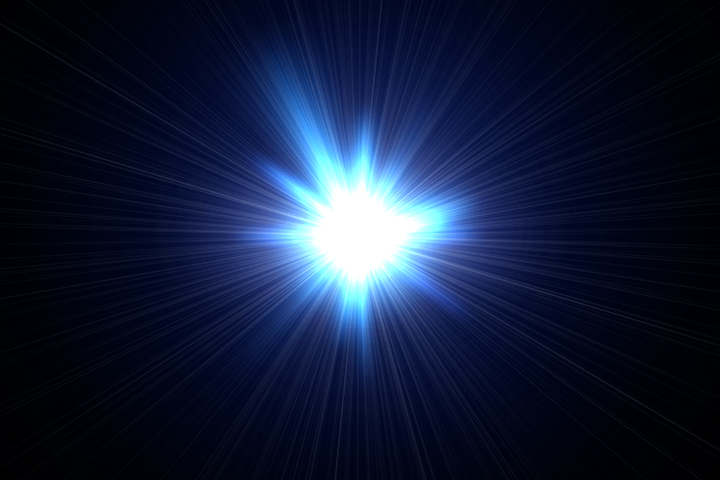
These still images show the expansion history of the Universe by modeling the Universe as a two-dimensional grid of galaxies. The Big Bang, shown as a flash of light, is immediately followed by rapid expansion of the Universe. This expansion then slows down because of the gravitational attraction of the matter in the Universe. As the Universe expands, the repulsive effects of dark energy become important, causing the expansion to accelerate.
(Credit: NASA/STScI/G. Bacon)
View Animation of the Effects of Dark Energy
13
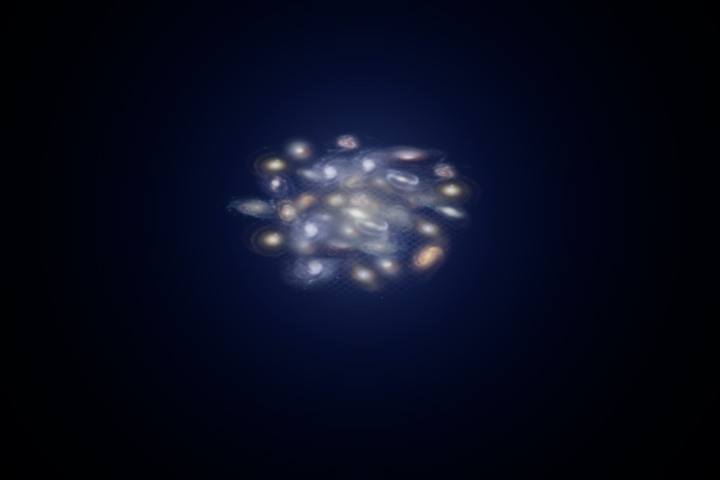
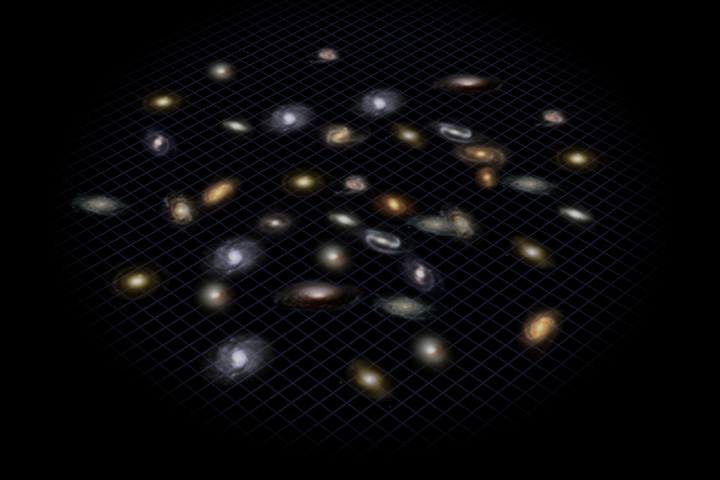
Animation Stills: Galaxy Cluster
These still images show a galaxy cluster, the largest gravitationally-bound objects in the Universe. Individual galaxies are shown in white and yellow, and the intergalactic gas is shown in red. Galaxy clusters contain as much mass as a million billion suns. The strong gravitational pull of this matter squeezes the gas and heats it to about 100 million degrees, making it only detectable in X-rays. Chandra found direct evidence for cosmic acceleration and dark energy, based on distance measurements to a sample of galaxy clusters.
(Credit: NASA/CXC/A. Hobart)
View Animation of a Galaxy Cluster
Return to Galaxy Clusters and Dark Energy (18 May 04)
Revised: May 17, 2022