
Welcome to
COLORING
THE UNIVERSE
Process
DATA TRANSLATION
How do you make images of things in space? More specifically, how do you make images of objects in space that are taken in a kind of light invisible to the human eye?
When a telescope like NASA’s Chandra X-ray Observatory captures data, they do not arrive as assembled snapshot. Instead, the spacecraft streams data encoded in the form of ones and zeroes, which are eventually translated into various formats, including images, that experts and non-experts can understand.
If you want to learn about
To understand this translation process, we need to discuss what astronomical data is – and is not. Satellite and spacecraft images are not really photographs, but pictorial presentations of measured data in different bands of the electromagnetic spectrum (i.e. radio, infrared, visible, ultraviolet, X-ray, gamma ray).
The detectors on spacecraft such as Chandra and even a “visible light” telescope like NASA’s Hubble Space Telescope do not take color images. Neither do most of the other space-based telescopes and instruments that look outward to the Universe or inward to planet Earth. Instead, color images are assembled from separate black & white images taken through colored filters. To produce one colored image, three separate images are collected through a red, a green, and a blue filter. The three images are then combined with image analysis software into one color image.
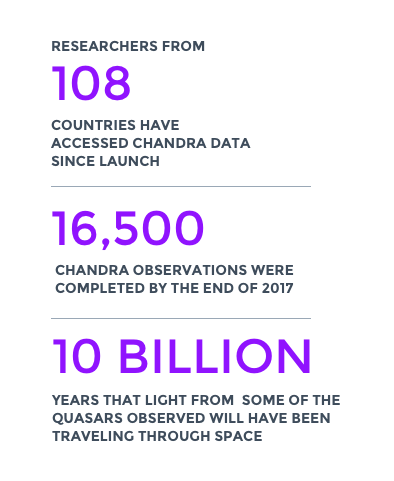
Computer aided data collection and processing is an essential facet of research using space and ground-based telescopes. Every 8 hours, the Chandra X-ray Observatory downloads millions of pieces of information to Earth. To control, process, and analyze this flood of numbers, scientists rely on computers, not only to do calculations, but also to change data into images. Although computers are used extensively, scientists and programmers go through painstaking calibration and validation processes to ensure that computers produce technically correct images.
Recording Photons
When a satellite observes an object in space, its camera records photons. These photons come down to Earth from the spacecraft via a network in the form of 1's and 0's. Scientific software then translates that data into an event table that contains the time, energy and position of each photon that struck the detector during the observation. The data is further processed with software to form the visual representation of the object.
Today, a majority of astronomical images are taken with a Charged Coupled Device (CCD). In X-ray astronomy for example, CCDs have the ability to provide information about how energetic the X-ray was that the instrument recorded. For each one of the X-rays that the telescope records there is a measurement of how much energy is deposited in the CCD. The energy that is deposited is directly related to how much energy the X-ray itself had.

Example: Sagittarius A
Chandra's unprecedented imaging capabilities have provided an extraordinary window into the high-energy Universe. Simultaneous advancements in computing power and image processing algorithms provide the additional tools needed to produce scientifically accurate yet aesthetically pleasing images of the Universe from Chandra data. Such public images can serve an integral part of the legacy of these observatories by visually telling the stories of complex scientific achievements as well as nuanced interim advancements. The responsibility lies with the image processing team to balance the beauty of the data with the scientific story behind them.
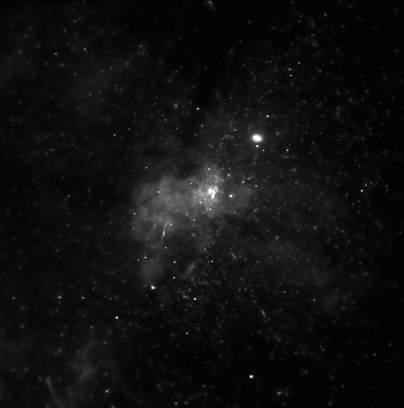
This example shows a series of steps in the production of an image for Sagittarius A* (Sgr A*), the area around the supermassive black hole at the center of our Milky Way galaxy. The series moves the viewer from a single observation of Sagittarius A* to a merged image combining data from multiple observations. Note the improved signal to noise of the image on the first images, but also the presence of "readout streak" artifacts on the bright point source to the lower right of center even after initial processing. Finally a before and after comparison shows the same field of view of Sagittarius A* with the initial three-color combination on the left compared to the final public image (right) after image smoothing, intensity, contrast and color adjustments. Both colored images are coded by X-ray energies: Red (2-3.3 keV), Green (3.3-4.7 keV), Blue (4.7-8 keV). Image Credits: NASA/CXC/SAO
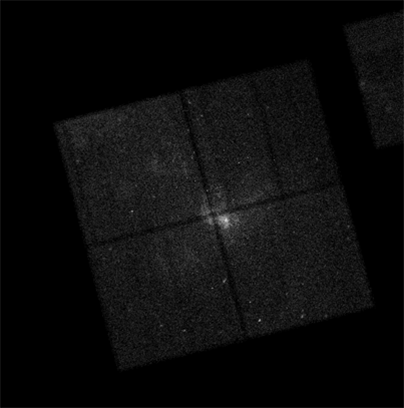
A single observation of SgrA* Note the chip gaps.
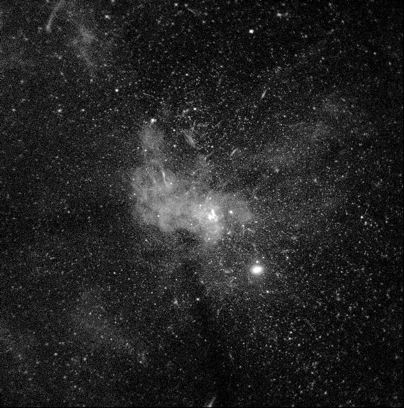
A merged image of 45 pointing equaling 1.4 megaseconds of data.
The merged image first smoothed to bring out detail and then a 20% overlay of the merged image to bring back some noise.
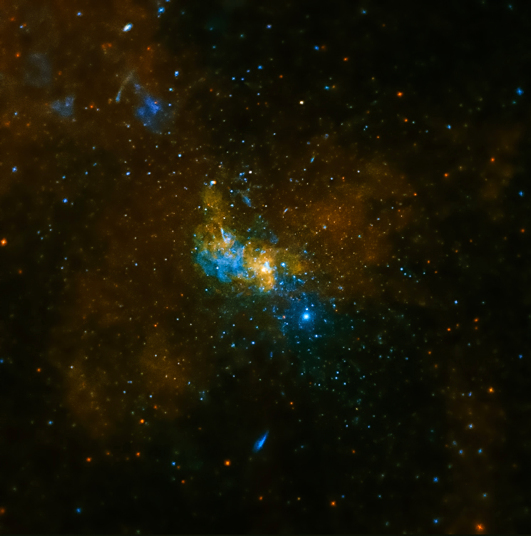
A 3 color combination of the data before photoshop.
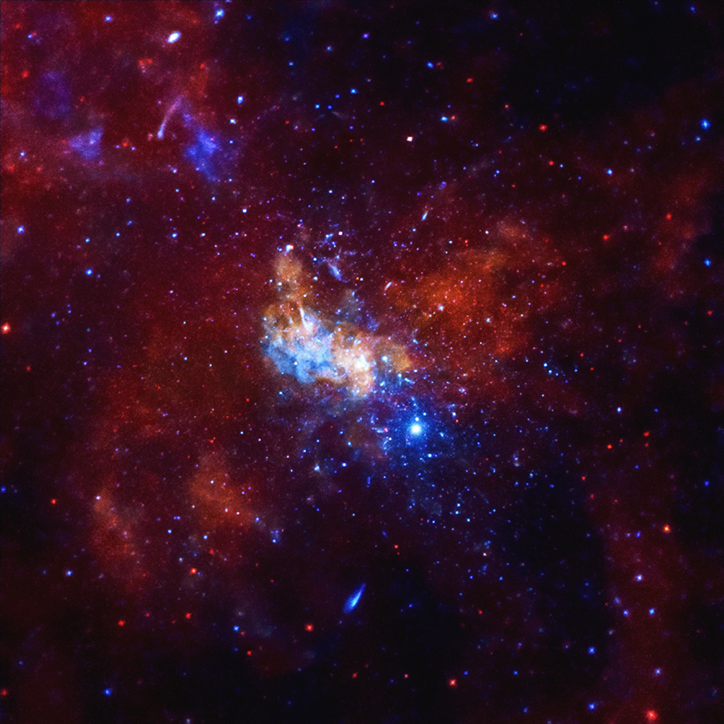
The final image after color enhancements in photoshop.
Process
COLOR IN SCIENCE
The colors we see in the world around us are the result of the way that the human eye and brain perceive different wavelengths of light in the visible part of the electromagnetic spectrum. X rays, and other wavelengths such as radio, infrared, ultraviolet and gamma-rays, cannot be seen with the human eye, and thus do not have any "color." To see the invisible wavelengths, detectors sensitive those other wavelengths are needed.
Images taken by telescopes that observe at the "invisible" wavelengths are sometimes called "false color images" or "representative color images." That is because the colors used to make them are chosen to bring out important details. The color choice is usually a combination of what works best to show the data, as well as aesthetic choice. The color selection is used as a type of code in which the colors can be associated with the intensity or brightness of the radiation from different regions of the image, or with the energy of the emission.
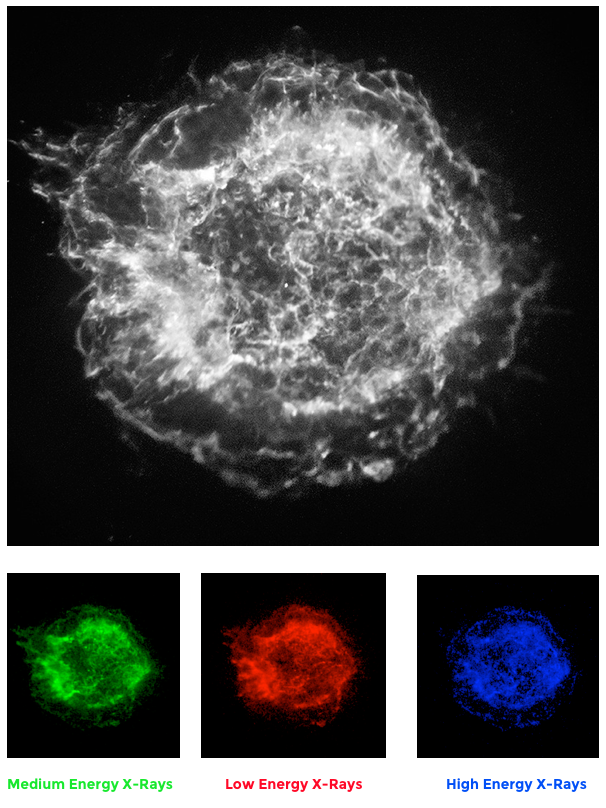
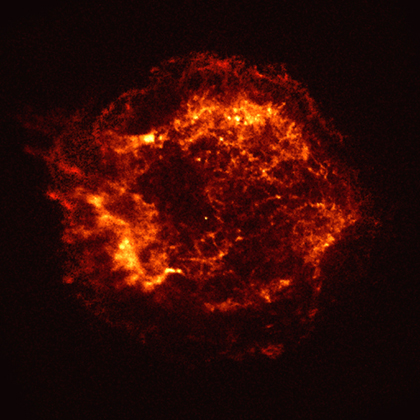
In the black and white Chandra X-ray image of the supernova remnant Cassiopeia A (Cas A) shown above, the darker shades represent the most intense X-ray emissions, the lighter shades of gray represent the areas of less intense emission, and the white areas represent the areas of little to no emission.
In the yellow and orange version on the right, a different "color code" is shown. There, the white and yellow colors represent the areas of highest X-ray intensity, the orange to red areas represent the areas of lower intensity, and the black represents little or no emission. Variations in intensity in an X-ray image are usually associated with variations in the density, or concentration, of hot gas. In this image, the bright regions are associated with shock waves produced by an expanding shell of hot gas.
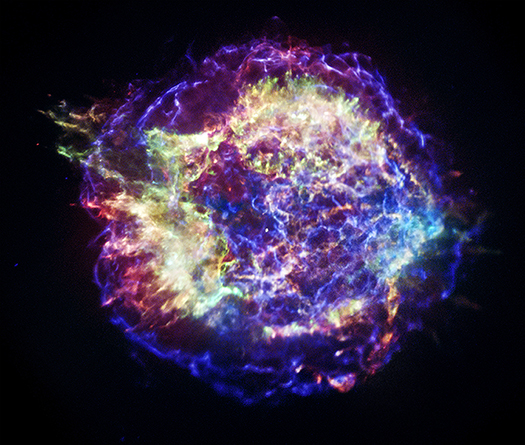
The version of Cas A on the right shows an image constructed by selecting different X-ray energy bands from the data, and using a color code to represent these. This representation can highlight temperature variations in the gas, with higher temperatures associated with higher energy X-rays, etc. The choices of energy bands and colors are arbitrary, but X-ray astronomers generally follow the convention that the low, medium, and higher X-ray energy bands of the Chandra data are shown as red, green, and blue respectively. In this particular image, red, green and blue represents X-ray energy bands of 0.3 to 1.55 kilovolts, 1.55 to 3.34 kilovolts, and 3.34 to 10 kilovolts, respectively.

Example:
Cassiopeia A
The data that is received by telescopes originates in black and white. Color is then added to the image. To do this, scientists put together color maps, usually by temperature or energy level (for example assigning red to lower energy cuts, green to middle energy cuts, blue to higher energy cuts), sometimes by elemental makeup. Astrophysicists don't assign the same color map for every object a telescope images. In this image of supernova remnant Cassiopeia A shown at left, colors were chosen to emphasize emission from particular energy ranges, such as low-energy X-rays (red), medium-energy X-rays (green), and high-energy X-rays (blue). This is adding to the informational quotient of an image.
Developed by the Chandra X-ray Center, at the Smithsonian Astrophysical Observatory, in Cambridge, MA, with funding by NASA under contract NAS8-03060 | Privacy | Accessibility