
CXC Home | Search | Help | Image Use Policy | Latest Images | Privacy | Accessibility | Glossary | Q&A
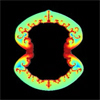
1. Simulation of Kepler supernova explosion
QuicktimeMPEG This video shows a simulation of the Kepler supernova as it interacts with material expelled by the giant star companion to the white dwarf before the latter exploded. It was assumed that the bulk of this material was expelled in a disk-like structure, with a gas density that is ten times higher at the equator, running from left to right, than at the poles. The colors represent the density of the gas, using a rainbow distribution, with red showing the highest densities, followed by orange, yellow and green, then blue showing the lowest densities. Note the dense structure on the left and right of the explosion. This simulation was performed in two dimensions, so this is a cross-section of the explosion. The simulation has to be projected into three dimensions to compare with observations. The good agreement with Chandra and Spitzer data supports the author's interpretation of the disk-like structure they observed.
[Runtime: 00:13]
(NASA/CXC/NCSU/J.Blondin et al.)
Related Chandra Images:
- Photo Album: Kepler's Supernova Remnant
2. Learn About Supernovas
QuicktimeMPEG Audio Only
Supernovas are some of the most dramatic events in the cosmos. These titanic events send shockwaves rumbling through space and create giant bubbles of gas that have been superheated to millions of degrees.
Chandra has captured supernovas and the remnants they've left behind in spectacular X-ray images.
Chandra's images help to determine the energy, composition and dynamics of these celestial explosions.
See supernovas through Chandra's eyes.
[Runtime: 01:31]
(NASA/CXC/A. Hobart)
QuicktimeMPEG Audio Only
- Audio (404.5 kb)
Supernovas are some of the most dramatic events in the cosmos. These titanic events send shockwaves rumbling through space and create giant bubbles of gas that have been superheated to millions of degrees.
Chandra has captured supernovas and the remnants they've left behind in spectacular X-ray images.
Chandra's images help to determine the energy, composition and dynamics of these celestial explosions.
See supernovas through Chandra's eyes.
[Runtime: 01:31]
(NASA/CXC/A. Hobart)
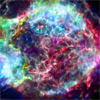
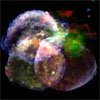
3. Chandra X-ray Element Map
QuicktimeMPEG This video of the Chandra X-ray images shows the distribution of iron, sulfur and magnesium in the supernova remnant. The data show that the distributions of sulfur and silicon are similar, as are the distributions of magnesium and neon. Oxygen, which according to theoretical models is the most abundant element in the remnant, is difficult to detect because the X-ray emission characteristic of oxygen ions is strongly absorbed by gas in along the line of sight to Cas A, and because almost all the oxygen ions have had all their electrons stripped away.
[Runtime: 00:16]
(NASA/CXC/A. Hobart)
Related Chandra Images:
- Photo Album: Cassiopeia A
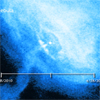
4. Chandra Motion Sequence of Crab Nebula
QuicktimeMPEG A new movie from NASA's Chandra X-ray Observatory shows a sequence of Chandra images of the Crab Nebula, taken over an interval of seven months. Dramatic variations are seen, including the expansion of a ring of X-ray emission around the pulsar (white dot near center) and changes in the knots within this ring. Chandra began observing the Crab on monthly intervals beginning six days after the discovery of the gamma-ray flare in September 2010. This established a baseline of seven images of the nebula before the superflare was seen just last month. When scientists saw that more flaring activity was beginning in April 2011, a pre-planned set of five Chandra observations was initiated. Two of these observations were made when strong gamma-ray flares occurred, but no clear evidence was seen for correlated flares in the Chandra images. The movie shows the April observations in "slow motion" to focus on the time when the gamma-ray superflares occurred. The movie shows three loops through the sequence of images, along with a timeline near the bottom.
[Runtime: 0.12]
View Stills
(NASA/CXC/MSFC/M.Weisskopf et al & A.Hobart)
Related Chandra Images:
- Photo Album: Crab Nebula
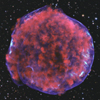
5. Multiwavelength Views of Tycho's Supernova Remnant
QuicktimeMPEG A long Chandra observation of Tycho has revealed a pattern of X-ray "stripes" never seen before in a supernova remnant. The stripes are seen in the high-energy X-rays (blue) that also show the blast wave, a shell of extremely energetic electrons. Low-energy X-rays (red) show expanding debris from the supernova explosion. The stripes, seen to the lower right of this composite image that includes optical data from the Digitized Sky Survey, may provide the first direct evidence that a cosmic event can accelerate particles to energies a hundred times higher than achieved by the most powerful particle accelerator on Earth.
[Runtime: 0.10]
(X-ray: NASA/CXC/Rutgers/K.Eriksen et al.; Optical: DSS)
Related Chandra Images:
- Photo Album: Tycho's Supernova Remnant
6. Animation of Black Hole Formation in SN 1979C
QuicktimeMPEG This animation shows how a black hole may have formed in SN 1979C. The collapse of a massive star is shown, after it has exhausted its fuel. A flash of light from a shock breaking through the surface of the star is then shown, followed by a powerful supernova explosion. The view then zooms into the center of the explosion. Red, slow-moving material in a disk is shown falling onto the white neutron star that formed when the star collapsed. The rate of infall onto the neutron star increases until the star collapses into a black hole. Matter should continue to fall into the black hole and generate bright X-ray emission for many years.
[Runtime: 00:20]
(NASA/CXC/A.Hobart)
Related Chandra Images:
- Photo Album: SN 1979C
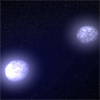
7. Animation of Merger Trigger for Supernova
QuicktimeMPEG This animation shows the main way that new Chandra results indicate Type Ia supernova are triggered in elliptical galaxies. Two white dwarf stars orbit each other and lose energy via gravitational radiation, eventually resulting in a merger between the two stars. Because the total mass of this merger exceeds the weight limit for a white dwarf, the merged star is unstable and explodes as a Type Ia supernova.
[Runtime: 0.20]
View Stills
(NASA/CXC/A.Hobart)
Related Chandra Images:
- Photo Album: M31
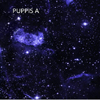
8. Images of Cosmic Cannonball
QuicktimeMPEG This sequence begins with a wide-field CTIO optical image which then combines with an X-ray image from the ROSAT observatory of Puppis A, the debris field created when a massive star exploded at the end of its life. The next image from Chandra shows the close-up view of the small, dense object, known as a "neutron star", left behind after the explosion. Chandra observations from 1999 and 2005 clearly show that the neutron star has moved over a period of five years. Astronomers calculate this neutron star is traveling at about 3 million miles per hour and is destined to exit the Galaxy million of years from now.
[Runtime: 0:12]
(Chandra: NASA/CXC/Middlebury College/F.Winkler et al.; ROSAT: NASA/GSFC/S.Snowden et al.; Optical: NOAO/AURA/NSF/Middlebury College/F.Winkler et al.)
Related Chandra Images:
- Photo Album: RX J0822-4300 in Puppis A
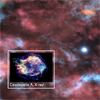
9. Chandra Comparison of Type Ia Supernova Remnants
QuicktimeMPEG This sequence compares the Chandra image of Kepler's SNR with the Chandra images of 3 Type Ia supernova remnants located in the Milky Way. The X-ray emission for Kepler's remnant contains a bright central region similar to DEM L238, while the X-ray emission for Tycho's remnant and SN 1006 are generally much more uniform. These results suggest that the stars that exploded and caused the Kepler and DEM L238 supernova remnants were much younger than the stars that produced the Tycho and SN 1006 remnants.
[Runtime: 0.20]
(X-ray: NASA/CXC/NCSU/S.Reynolds et al; Optical: DSS)
Related Chandra Images:
- Photo Album: Kepler's Supernova Remnant
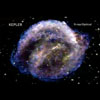
10. Chandra's Kepler Image from Optical View
QuicktimeMPEG This sequence begins with an optical view of the region containing the Kepler supernova remnant. After zooming in, Chandra's X-ray image appears, showing the dramatic difference between what is seen in various wavelengths.
[Runtime: 0.12]
(X-ray: NASA/CXC/NCSU/S.Reynolds et al; Optical: DSS)
Related Chandra Images:
- Photo Album: Kepler's Supernova Remnant
Revised: March 24, 2023