

CXC Home | Search | Help | Image Use Policy | Latest Images | Privacy | Accessibility | Glossary | Q&A
Download Image
More Information
More Images
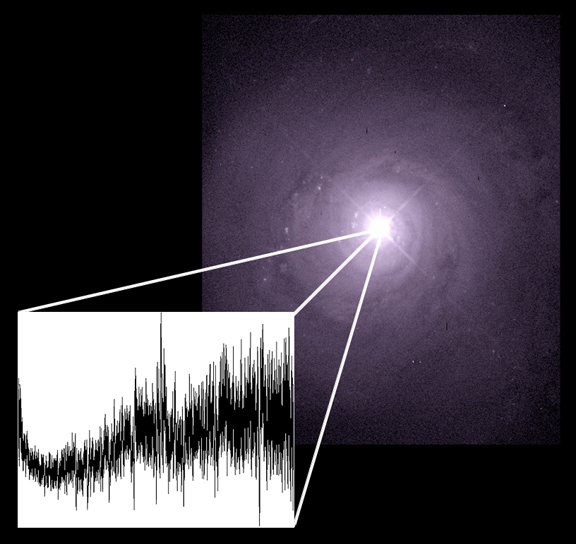
Hubble Image of NGC 5548, with Chandra X-ray Spectrum of Central Region
(Credit: Optical: NASA/HST; X-ray: NASA/SRON/CXC/SAO)
Related Images
NGC 5548:
Chandra Reads the Cosmic Bar Code of Gas Around a Giant Black Hole

Chandra Reads the Cosmic Bar Code of Gas Around a Giant Black Hole
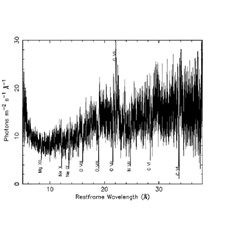
This figure is the X-ray spectrum of the central region of the galaxy, NGC 5548. The spectrum shows the number of X-rays present at each energy or wavelength, and amounts to a cosmic bar code. It allows scientists to take an inventory of the gas around the giant black hole in the center of the galaxy. The deep valleys in the spectrum are produced when a blanket of warm (few million degree) gas absorbs X-rays of specific energies from hotter gas close to the central black hole.
Absorption lines, or valleys, due to the elements carbon, nitrogen, oxygen, neon and magnesium can be seen in the figure. A peak in the spectrum due to emission from oxygen is also identified. The Roman numerals refer to how many electrons have been stripped from the atoms. e.g. OVIII is an ion that has lost 7 electrons from its atomic shell, NeX has lost 9 electrons, etc. Detailed analysis shows that absorption lines from elements silicon, sodium, and iron are also present.
The exact position of the lines relative to laboratory standards shows that the lines are shifted systematically to shorter wavelengths by a fraction of a percent. This shift is due to the gas moving away from the source (Doppler effect). It indicates that the blanket of absorbing gas is flowing away from the black hole at about a million kilometers per hour (600,000 miles per hour), probably because of the enormous amount of energy radiated by the extremely hot gas very near the black hole.
Chandra X-ray Observatory Low Energy Transmission Grating (LETG)/High Resolution Camera Image.
|
||||||||||||||||||||||
Visual Description:
The graphic features an X-ray spectrum of a Seyfert galaxy named NGC 5548, which is a type of active galactic nucleus (AGN). In the image, there is a purple spiral shape with a white core in the middle, which shows the galaxy. To the left of the image, there is a representation of the X-ray spectrum of the Seyfert galaxy NGC 5548. The structure of the X-ray spectrum can be compared to a sound wave, with the different wavelengths corresponding to different frequencies. This comparison highlights the importance of analyzing the X-ray spectrum to learn about the properties of the object emitting the X-rays, such as its temperature, density, and composition.
Revised: September 10, 2025