


CXC Home | Search | Help | Image Use Policy | Latest Images | Privacy | Accessibility | Glossary | Q&A
1
Chandra X-ray Image of Mira
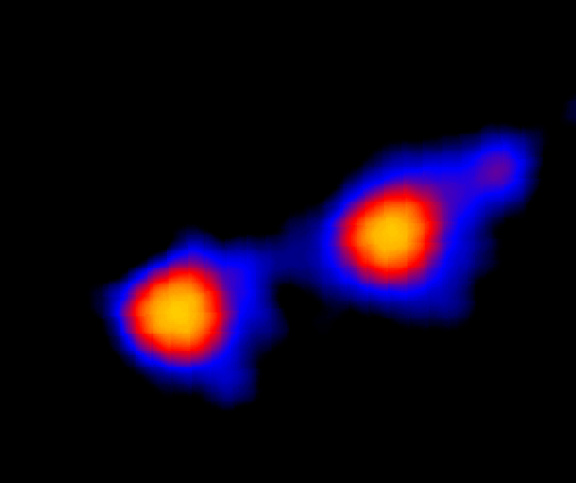
The Chandra image shows Mira A (right), a highly evolved red giant star, and Mira B (left), a white dwarf. Mira A is losing gas rapidly from its upper atmosphere via a stellar wind. Mira B exerts a gravitational tug that creates a gaseous bridge between the two stars. Gas from the wind and bridge accumulates in an accretion disk around Mira B and collisions between rapidly moving particles in the disk produce X-rays.
Scale: 1.2 arcsec per side
(Credit: NASA/CXC/SAO/M. Karovska et al.)
2
HST Ultraviolet Image of Mira
The ability to distinguish between the interacting stars Mira A & B allowed a team of scientists to observe an X-ray outburst from Mira A. An ultraviolet image made by the Hubble Space Telescope February 16, 2004, was key to identifying the X-ray outburst with the red giant star.
Scale: 1.2 arcsec per side
(Credit: NASA/M. Karovska et al.)
3
Illustration of Mira System
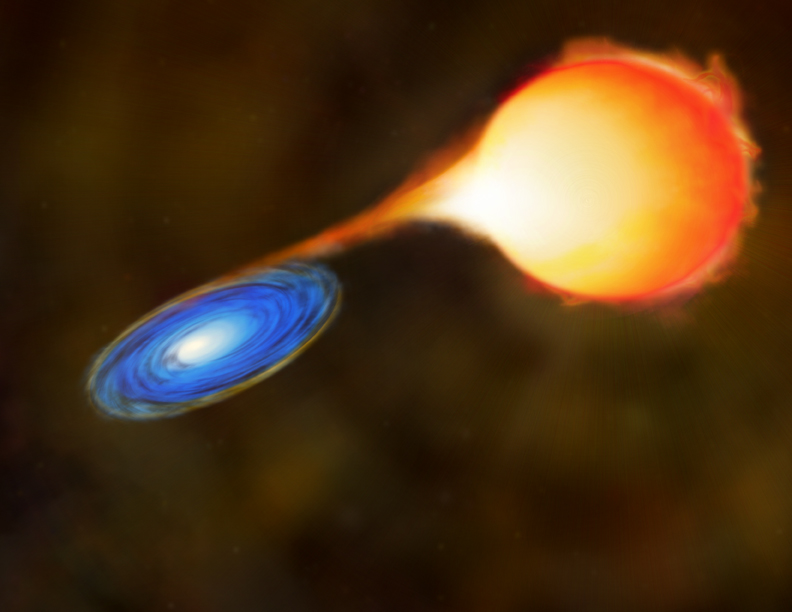
This artist's conception of the Mira star system depicts Mira A (right), a highly evolved red giant star, and Mira B (left), a white dwarf. Mira A is losing gas rapidly from its upper atmosphere via a stellar wind. Mira B exerts a gravitational tug that creates a gaseous bridge between the two stars. Gas from the wind and bridge accumulates in an accretion disk around Mira B and collisions between rapidly moving particles in the disk produce X-rays.
(Credit: NASA/CXC/M.Weiss)
4
Chandra X-ray Spectrum of Mira
This graphic shows the Chandra spectrum for Mira (white crosses) and the best spectral fit (solid yellow line). This spectrum was obtained during the 70,000-second exposure on December 6, 2003. The Chandra spectrum shows strong emission from lower-energy X-rays and potentially multiple components of the higher, or "harder," X-rays.
(Credit: NASA/CXC/SAO/M. Karovska et al.)
5
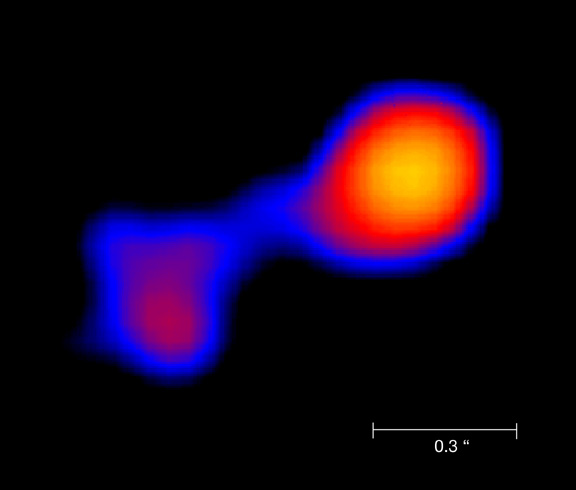
Chandra X-ray Image with Scale Bar
Scalebar: 0.3 arcsec
(Credit: NASA/CXC/SAO/M. Karovska et al.)
Scalebar: 0.3 arcsec
(Credit: NASA/CXC/SAO/M. Karovska et al.)
Return to Mira (28 Apr 05)
Revised: July 16, 2008