
CXC Home | Search | Help | Image Use Policy | Latest Images | Privacy | Accessibility | Glossary | Q&A
Introduction:
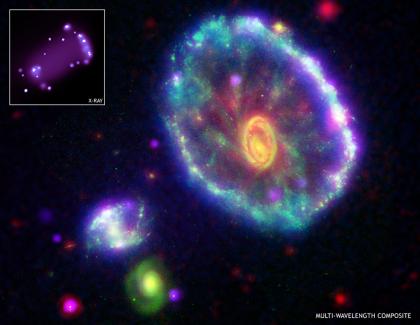
The Cartwheel Galaxy
Multi-Wavelength Composite
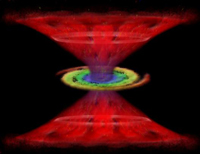
The Cartwheel Galaxy is part of a group of galaxies ~five hundred million (500x106) light years away in the direction of the constellation Sculptor. The composite image to the left shows the unique structure of the Cartwheel Galaxy. The image combines data from four different observatories: the Chandra X-ray Observatory (purple); the Galaxy Evolution Explorer satellite (ultraviolet/blue), the Hubble Space Telescope (visible/green), and the Spitzer Space Telescope (infrared/red). The ring-shaped rim of the Cartwheel Galaxy is the result of a rare and spectacular head-on collision between two galaxies. The Cartwheel Galaxy was probably a normal spiral structure galaxy similar to the Milky Way Galaxy before the collision. The spiral structure is beginning to re-emerge, as seen in the faint arms or spokes between the outer ring and the bulls-eye shaped nucleus. The gravitational disruption of a smaller intruder galaxy passing through the Cartwheel Galaxy compressed the interstellar gas and dust – causing a wave of star formation to move out from the impact point like a ripple across the surface of a pond.
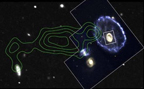
The Intruder Galaxy
(NRAO, ISU, Hughes STX, STScI, NASA)
The image to the right is a composite showing an optical image of the Cartwheel galaxy and several smaller galaxies associated with the Cartwheel group superimposed with high resolution radio observations of neutral hydrogen (traced by the green contours). The neutral hydrogen trail suggests that the intruder galaxy could be the galaxy located at the lower left of the image.
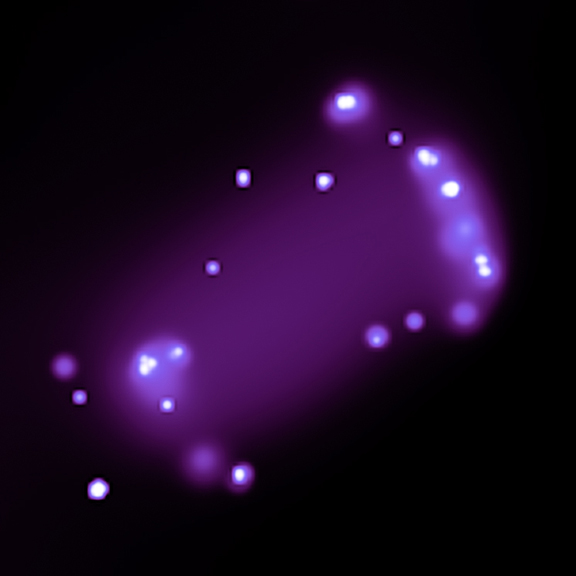
U/HLX’s in Cartwheel Galaxy
(Chandra Image)
The Cartwheel Galaxy provides an opportunity to study how extremely massive stars are formed in large fragmented gas clouds. The ring structure contains several billion new stars that would not normally have been created in such a short time span. When the most massive of these stars undergo catastrophic collapse as supernova events, neutron stars and black holes are formed. Young supernovas and supernova remnants are ultra and hyperluminous X-ray sources (U/HLXs). Some of the neutron stars and black holes are in contact binary systems with companion stars. Material is pulled from the companion stars and forms accretion discs around the neutron stars and back holes due to their extreme gravitational fields. The in-fall of material from the accretion disc produces highly energetic X-rays, so these systems are also classified as U/HLXs.
Purpose:To examine and compare the Cartwheel Galaxy in optical and X-ray bands and determine the sources of the ultra- and hyperluminous x-rays (U/HLXs).
Procedure:
Install the software and load the FITS file (data/image file):
- 1. Download and install ds9 (http://chandra-ed.cfa.harvard.edu/install_2014.html)
- 2. Open ds9. From the menus, choose Analysis>Virtual Observatory>Chandra-Ed Archive Server.
- 3. In the new window that comes up, scroll down to and click ObsID 2019 - THE CARTWHEEL'S RING.
- 4. When the image is loaded, go back to the SAOImage ds9 window. Maximize your screen. Choose Scale>Square Root and Color>b.
Acquiring the optical image:
- 5. Choose Analysis>Image Servers>SAO-DSS and then click Retrieve in the new window that comes up. What are the coordinates of the Cartwheel Galaxy?
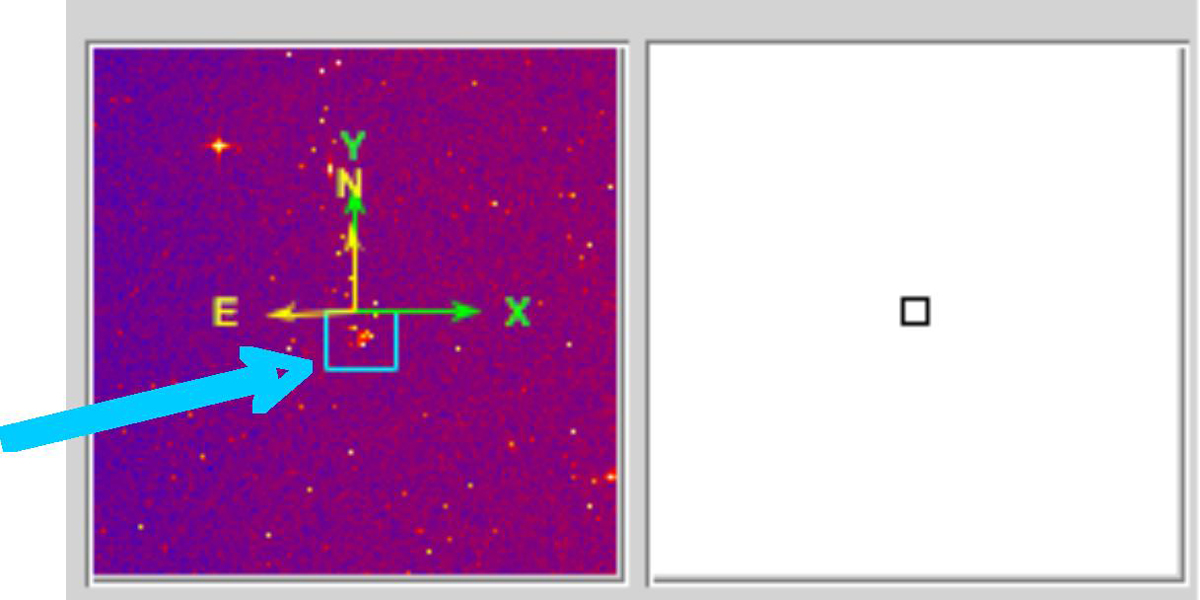
right ascension -α__________________________, declination -δ__________________________ - 6. With the new frame on the right chosen (it should be outlined in blue), choose Zoom>Zoom 4. Center the Cartwheel Galaxy in the frame by moving the blue rectangle over it in the small image in the upper right corner (see below).
Matching up the x-ray and optical images:
- 7. With the frame on the right still chosen, go to Frame>Match Frames>WCS.
- 8. Click the frame on the left. Adjust the contrast and bias to better see the point x-ray sources using Colors>Colormap Parameters (suggested settings, Contrast-4.4, Bias-0.25).
- 9. Contour lines may help define these x-ray sources. Go to Analysis>Contours and then Analysis>Contour Parameters. In the new window, use these settings: Contour levels-10, Contour Smoothness-1, Low-0, High-550 and then click Generate, Apply and Close.
- 10. To explore where these x-rays sources are located in the optical image, choose Edit>Crosshair and Frame>Lock Crosshairs>WCS. Move your cursor (while holding the left click) over the x-ray point sources. Note their locations on the optical image.
Determining the size of the ring:
- 11. Go to Edit>Pointer. Click the right frame. Left click (hold this down) in the center of the Cartwheel Galaxy and drag a circular region around the galaxy. The region should be just big enough to enclose the entire ring. Once you have drawn the region, if you left click on it again, green squares will appear in the corners of the region. You can left click in the center and drag the circle to the correct spot if it is slightly off-center or change the size by left-clicking on one of the green squares at the corner and dragging.
- 12. Click on the left frame. Go back to Edit>Crosshair.
Move the crosshairs on the x-ray image to determine the diameter of the region you drew in #11 in the optical image. Record the physical x- and y-coordinates (see upper left corner of the window) of two points on opposite sides of the circle.
(x1, y1) = ( ________ , ________ ) (x2, y2) = ( ________ , ________ )
Find the distance in pixels between these points using
- 13. In a Chandra observation, 1 pixel = 0.5 arc sec. Also, 1 radian = 206,265 arc sec. Convert your answer from #12 to radians.
- 14. Use the small angle formula below to determine the size of the ring in light years. The distance to the Cartwheel Galaxy is ~380 million light years. How does the size of the ring compare to that of the Milky Way Galaxy (~100,000 light years in diameter)?
angular size in radians= (actual size of object) / (distance to object)

Conclusions and Analysis:

Cartwheel Galaxy
(Hubble)
The gravitational disruption of a smaller intruder galaxy passing through the Cartwheel Galaxy compressed the interstellar gas and dust -causing a wave of star formation to move out from the impact point like a ripple across the surface of a pond at ~200,000 mi/hr. The wave of new star formation from the head-on collision has produced the ring-like structure seen in the optical image to the left.
- 1. In the Hubble image above, the bright blue knots represent areas of new star formation. How do the locations of the majority of X-ray sources compare to these areas?
- 2. Using the information above and your answer to #14, determine how long ago the collision of galaxies may have occurred. (1 light year = 5.87849981 x 10¹² miles)
Chandra AGN
Illustration
Comparing the X-ray and optical images of the Cartwheel Galaxy, does the galaxy seem to have an AGN? Explain.
- 4. Use the information provided, your analysis, and the chart of stellar life spans below to explain what types of objects each of the X-ray sources might be. You may have a different answer depending upon the location of the x-ray source (i.e. along the ring, within the ring, outside the ring).
- 5. Compare your findings to those published in the paper, Nonnuclear Hyper/Ultraluminous X-Ray Sources in the Starbursting Cartwheel Ring Galaxy, Yu Gao,1 Q. Daniel Wang,1 P. N. Appleton,2 and Ray A. Lucas3, The Astrophysical Journal Letters, 596:L171-L174, 2003 October 20.
http://www.iop.org/EJ/article/1538-4357/596/2/L171/17541.html
| Star Mass (solar masses) |
Time (years) | Spectral Type | Color |
| 60 | 3 million | O3 | bluest |
| 30 | 11 million | O7 | bluest |
| 10 | 32 million | B4 | bluish |
| 3 | 370 million | A5 | blue-white |
| 1.5 | 3 billion | F5 | white |
| 1 | 10 billion | G2 (Sun) | yellow |
| 0.1 | 1000's billion | M7 | red |
Suggestions for further investigations of colliding or starburst galaxies using ds9:
- 1. The Antennae: Chandra Locates Mother Lode of Planetary Ore in Colliding Galaxies
http://chandra.harvard.edu/photo/2004/antennae/ - 2. M82: Images From Space Telescopes Produce Stunning View of Starburst Galaxy
http://chandra.harvard.edu/photo/2006/m82/index.html
To load the images into ds9, go to Analysis>Virtual Observatory>Chandra-Ed Archive Server. In the new window that comes up, scroll down to the bottom of the page and click Unofficial Chandra Public Archive. In the next window enter the OBS ID given in "Fast Facts" section of the links above. Click Search and then the link that comes up under Title. In addition to the type of analysis you have done in this activity, you can analyze the spectra of these galaxies. Instructions for analyzing spectra are in the ds9 activity, X-Ray Spectroscopy of Supernova Remnants located at:
http://chandra.harvard.edu/edu/formal/snr/ds9.html
Revised: July 05, 2014