
CXC Home | Search | Help | Image Use Policy | Latest Images | Privacy | Accessibility | Glossary | Q&A
Introduction to the H-R Diagram:
The evolutionary sequences for stars are described by their position on a graph called the Hertzsprung-Russell (H-R) diagram. Most stages of stellar evolution, beginning with protostars, have a specific position on the H-R diagram. The different branches of the H-R diagram described below will be referred to throughout the descriptions of the evolutionary sequences for different mass stars that follow.
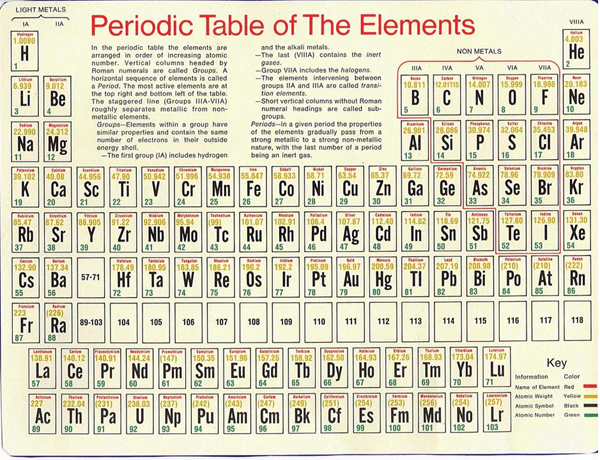
The Periodic Table of the Elements
The periodic table of the elements is an arrangement of all the known elements in order of increasing atomic number. The reason why the elements are arranged as they are in the periodic table is to fit them all, with their widely diverse physical and chemical properties, into a logical pattern. The vertical lines of elements, called groups, and the horizontal lines of elements, called periods, are chemically similar, and share a common set of characteristics. The elements are also arranged into blocks that share commonalities. The arrangement of the elements in the periodic table shows the periodicity and trends of some properties, such as electron configuration, metalicity, atomic radii, and melting points. The location of any individual element in the table determines the characteristics and properties of that element, as well as what types of chemical bonds it forms and chemical reactions it will undergo.
The Hertzsprung-Russell (H-R) Diagram
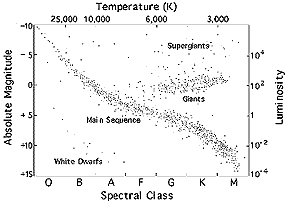
The Hertzsprung-Russell diagram, or H-R diagram, is the periodic table of the stars – an analog of the periodic table of the elements. It was discovered that when the luminosity (absolute magnitude or brightness) of stars is plotted against their temperature (stellar classification) the stars are not randomly distributed on the graph but are mostly restricted to a few well-defined regions. The stars within the same regions share a common set of characteristics, just like the groups, periods, and blocks of elements in the periodic table. Unlike the periodic table however, the physical characteristics of stars change over time, and therefore their positions on the H-R diagram change also – so the H-R diagram can be thought of as a visual plot of stellar evolution. It is a graphical tool that astronomers use to classify stars. From the location of a star on the graph, the luminosity, spectral type, color, temperature, mass, chemical composition, age, and evolutionary history are known.

Some Stars Plotted on the H-R Diagram
The Main Sequence: ~90% of all stars occupy the diagonal band running from the upper left corner (hot, luminous stars) to the lower right corner (cool, dim stars) of the H-R diagram. Stars become main sequence stars when the process of thermonuclear fusion - hydrogen to helium - stabilizes. These stars are in hydrostatic equilibrium - the outward radiation pressure from the fusion process is balanced by the inward gravitational force. When the transition from a protostar to the main sequence star occurs, the star is called a Zero Age Main Sequence (ZAMS) star. The determining factor of where a star is located on the main sequence is mass. The Sun is a G spectral class star with an effective surface temperature of ~5800K. Since the luminosity and mass of all other stars are measured relative to the Sun, the Sun has one solar luminosity and one solar mass. The O and B stars are the hottest and most massive, and the K and M stars are the coolest and least massive stars. The O and B stars are sometimes referred to as early sequence stars, and the K and M stars as late sequence stars. These terms refer to stars more massive (early sequence) than the Sun or less massive (late sequence) than the Sun. All one solar mass stars with hydrogen to helium fusion occurring within their cores, occupy the same position on the main sequence as the Sun; they stay in that location, with that specific relationship of temperature and absolute magnitude, until the hydrogen within the core becomes depleted and the fusion of hydrogen nuclei to helium nuclei stops. The mass-luminosity relationship for main sequence stars is defined as: L/L (Sun) ~ [M/M (Sun)]4. All main sequence stars with a mass less than ~8 solar masses are sometimes referred to as dwarf stars, with the coolest, least massive stars in the lower right corner called red dwarfs. The more massive the star, the faster the rate of fusion, and the less time it remains on the main sequence. The amount of time that a star spends on the main sequence is also a function of its mass and luminosity and is defined as: T(years) = 1010M/L. (See H-R diagram)

Revised: April 03, 2017