

CXC Home | Search | Help | Image Use Policy | Latest Images | Privacy | Accessibility | Glossary | Q&A
Purpose: To determine if two end products of stellar evolution – GK Per and Cen X-3 – could be white dwarfs or neutron stars by calculating the periods of X-ray pulses emitted by the two stellar cores using data recorded by the Chandra X-ray Observatory.
Background:
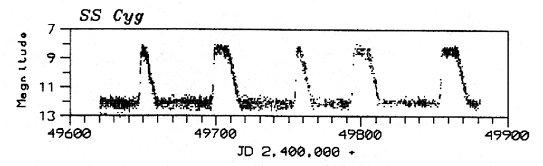
SS Cygni Light Curve, AAVSO
Variable Stars are stars that vary in magnitude (brightness). The behavior of stars that vary in magnitude can be studied by measuring their changes in magnitude over time and plotting the changes on a graph called a light curve. The example to the left is a light curve that shows the variability of SS Cygni over a 300 day period of observation. SS Cygni is a cataclysmic variable – stars that have occasional violent outbursts caused by thermonuclear processes either in their surface layers or deep within their interiors.
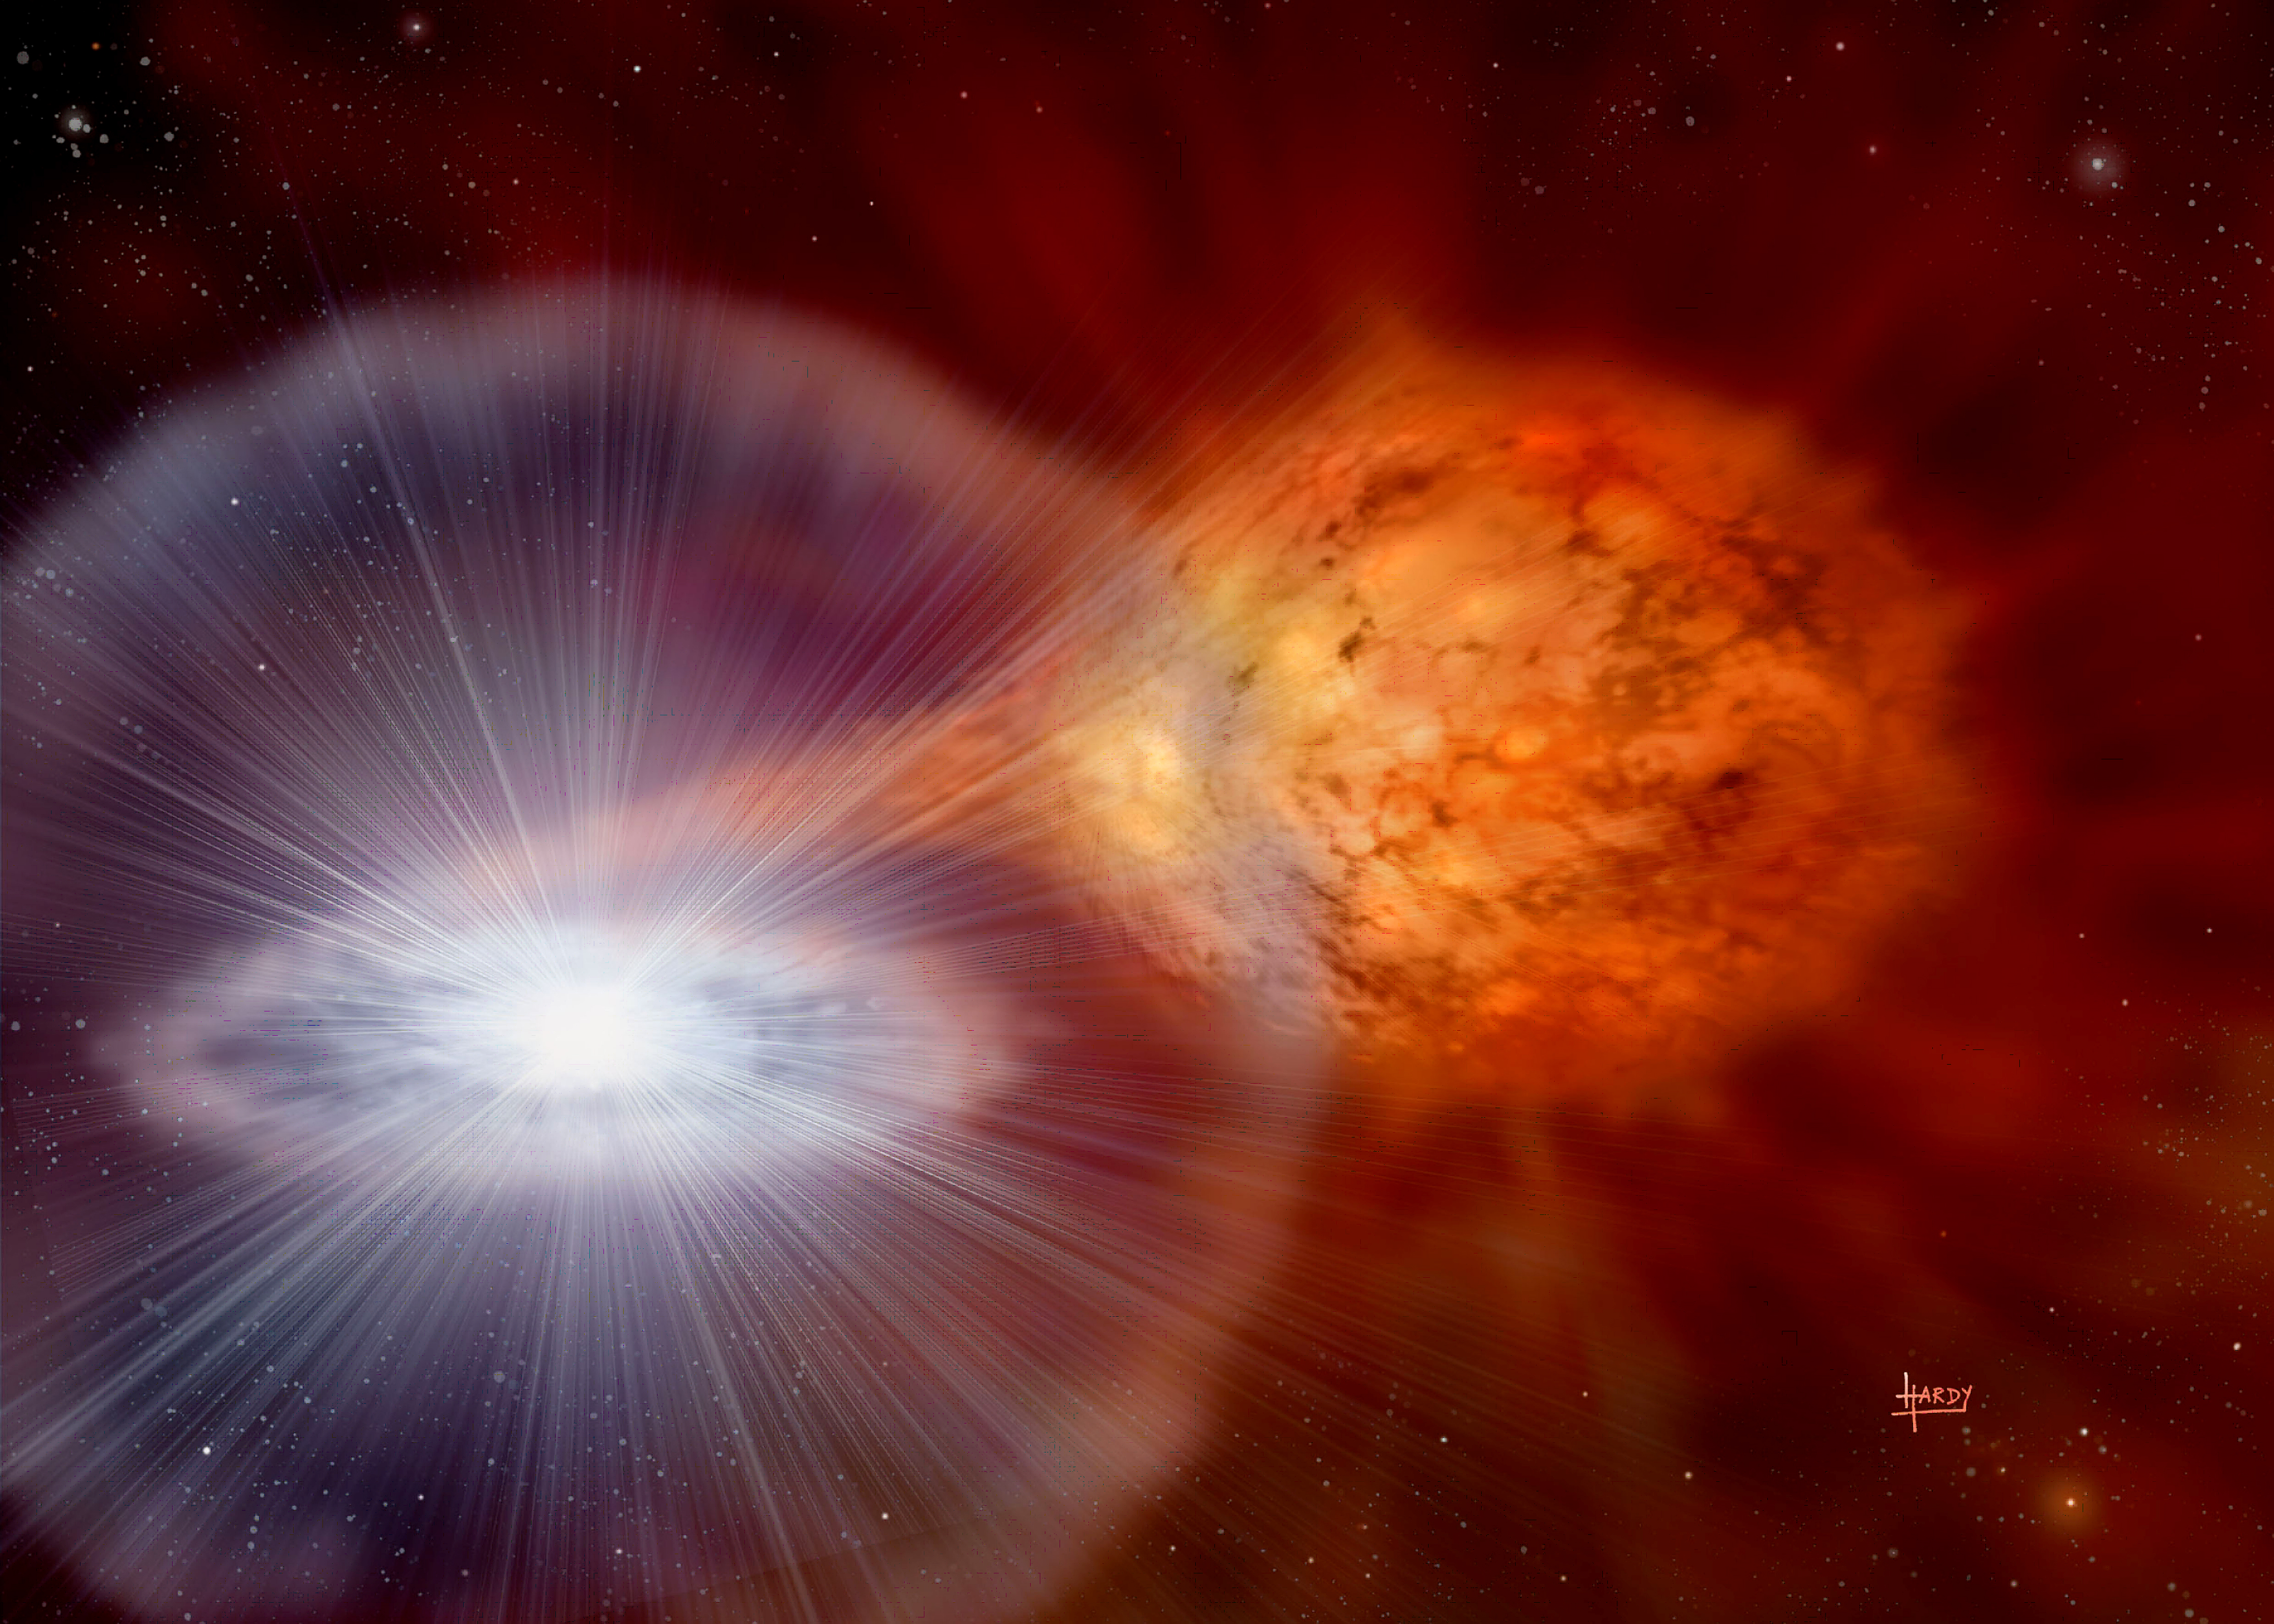
Illustration by David T Hardy, Artist
SS Cygni is also an example of a subclass of cataclysmic variables called dwarf novae. This is a close binary system consisting of a red dwarf star, cooler and less massive than the Sun, a white dwarf, and an accretion disk surrounding the white dwarf. The brightening of this system occurs when instability within the disk forces some of the disk material to drain down to the surface of the white dwarf triggering a Illustration by David T Hardy, Artist thermonuclear explosion. The SS Cygni light curve above shows 5 thermonuclear events within the 300 day observation period.
The SS Cygni light curve above was observed in the optical part of the spectrum and displays the dynamics among the accretion disk - the material in the disk that was accreted from its companion star - and the surface of the white dwarf. The white dwarf itself is the stellar core of a Sun-sized star at the end of its evolutionary history – a rotating carbon core. The light curve above is produced by the dynamics of the system and not the white dwarf itself, which emits most of its radiation in X-rays.
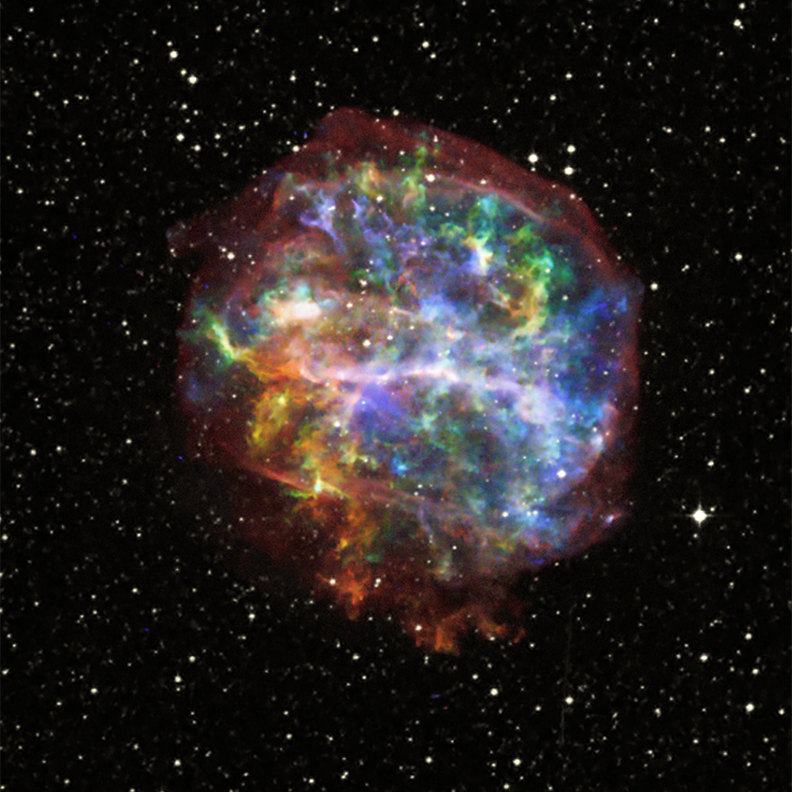
SNR G292.0+1.8, Chandra
More massive stars, which catastrophically collapse during supernova events, produce different types of stellar cores – including neutron stars – within the supernova remnants (SNR). Rotating neutron stars are called pulsars. Both white dwarfs and neutron stars are stellar cores – end products that remain after the evolution of their progenitor stars. Both objects rotate, though the much smaller neutron stars rotate much more rapidly than the larger white dwarfs. White dwarfs cannot exceed 1.4 solar masses, and neutron stars 2.4 solar SNR G292.0+1.8, Chandra masses. Neutron stars can also have companion stars and accrete materials from the companion star into an accretion disk surrounding the neutron star; a similar configuration to the SS Cygni star system described above.
Both white dwarfs and neutron stars generate strong emissions in X-rays, and the changes in X-ray brightness over time can be observed and recorded. The resulting light curve, just like the optical light curve of SS Cygni, can be used to determine the properties of these stellar cores.
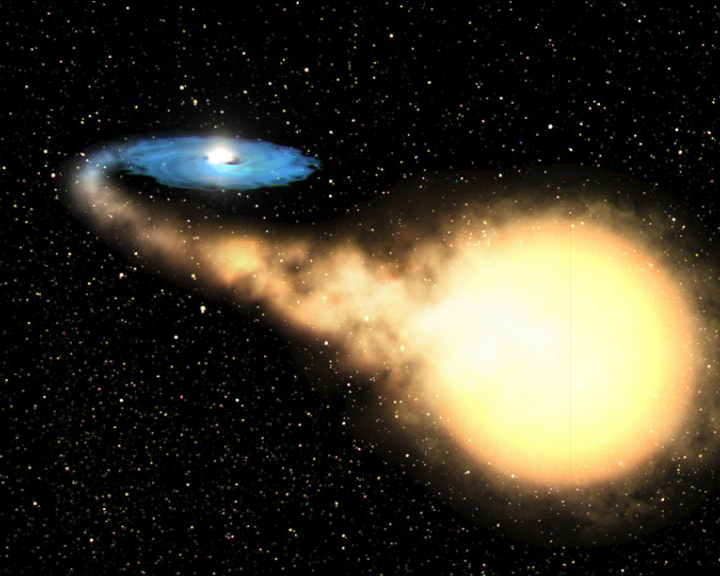
Illustration of an X-ray Binary
Some stellar cores emit X-rays that exhibit some regularity, so it is suspected that some sort of dynamic mechanism is producing the X-ray pulses that manifest themselves as changes in X-ray brightness. One such mechanism for rotating objects is “hot spots” which rotate into and out of the line of sight of the Chandra X-ray Observatory.
Illustration of an Accretion Powered Pulsar
A "hot spot" on a white dwarf can occur if a white dwarf with a magnetic field accretes matter from the companion star, and the accretion disk is disrupted at small radii by the white’s dwarf's magnetosphere. Material would then travel along the magnetic field lines. Above the surface of the white dwarf, the freefall kinetic energy of the material is converted into thermal energy, producing a strong shock wave. The material settles onto the surface of the white dwarf near the magnetic poles where it cools and emits X-rays. If the magnetic axis is offset from the spin axis, the X-ray emission will pulse with the spin period of the white dwarf. A neutron star in a binary system can become an accretion powered pulsar – producing a pulsing X-ray emission the same way as described for the white dwarf and shown in the illustration above.
GK Per and Cen X-3 are stellar cores that have been imaged by Chandra. Both objects exhibit variations in X-ray brightness that appear to display some regularity. This activity is a pencil and paper version that uses screenshots from ds9 – an image analysis software package – to analyze GK Per and Cen X-3 – in order to determine if they are white dwarfs and/or neutron stars. The physics equations and numbers necessary for the calculations are provided.
Procedure:
1. Figure 3. is a light curve of GK Per obtained from Chandra X-Ray Observatory data. This is a plot of brightness vs time. Does the change in brightness seem to be periodic? Estimate the possible period.
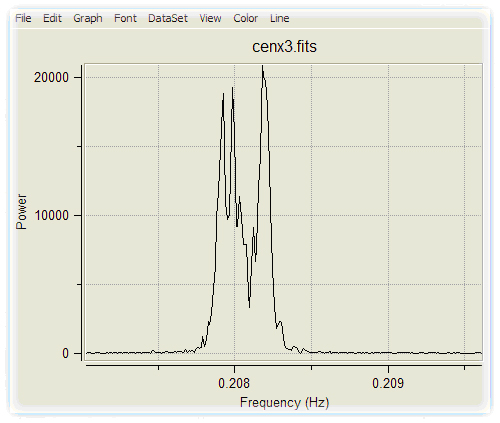
2. Figure 4. is a power spectrum of GK Per’s light curve. A power spectrum indicates the likelihood that certain frequencies (of rotation or other periodic phenomena) are present in the data. Zooming in on the tallest spike (Figure 5.), you can estimate the frequency of the x-ray "flashes" which is also the frequency of the rotation of GK Per. Calculate the period, T, by taking the inverse of the frequency, f (T = 1/f). How does this compare with the period you obtained from the light curve?
3. Repeat steps 1 and 2, using Figures 6, 7 and 8 for Cen X-3.
Calculations and Interpretations:
The acceleration due to gravity (g) on the surface of a star (according to Newton's Universal Law of Gravitation) is given by
g = (GM)/R2 where G = 6.67 X 10⁻¹¹ Nm2/kg2, M=star's mass and R = star's radius
Centripetal acceleration (ac) of an object on the surface of a star at its equator is given by
ac = V2/R and since V = 2πR/T for an object moving in a circle
ac = 4π2R/T2, where R = star’s radius and T = star’s spin period
If the centripetal acceleration on material on the star’s surface for a given period is less than the acceleration due to gravity, the gravitational force would be enough to hold the material on the surface and the star could sustain such a period without disruption.
1. Find the acceleration due to gravity on the surface of a white dwarf. Let the mass of a white dwarf be approximately one solar mass or 2.0 X 1030 kg and its radius, approximately that of Earth or 6.4 X 10⁶ m.
2. Find the acceleration due to gravity on the surface of a neutron star. Let the mass of a neutron star be two solar masses or 4 X 1030 kg and its radius be 10.0 km.
3. Assume GK Per is a white dwarf. Calculate the centripetal acceleration of material on the surface of GK Per (using the period you found from the power spectrum). According to your calculations, can GK Per be a white dwarf*? Why or why not?
4. If your answer above is “no”, repeat #3 assuming GK Per is a neutron star.
5. Repeat #3 and #4 for Cen X-3. Is it more likely that Cen X-3 is a white dwarf or a neutron star? Why?
*Note: Other analyses would be necessary to determine if an object is actually a white dwarf – including an examination of its temperature and luminosity.
Figure 3. Light Curve of GK Per
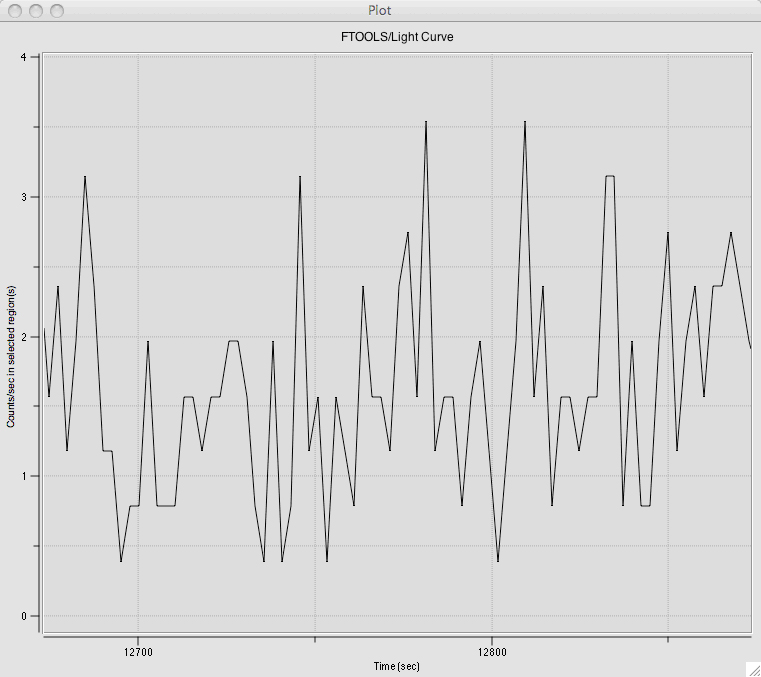
Figure 4. Power Spectrum of GK Per
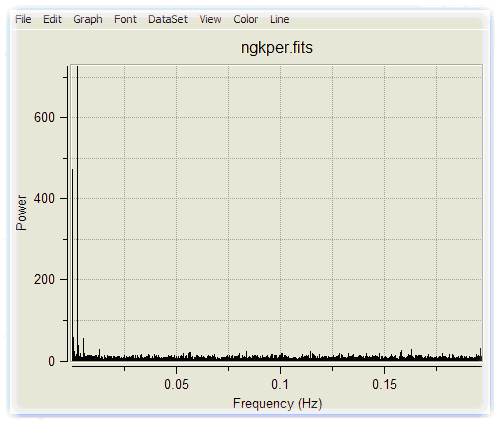
Figure 5. Zoom of Power Spectrum of GK Per
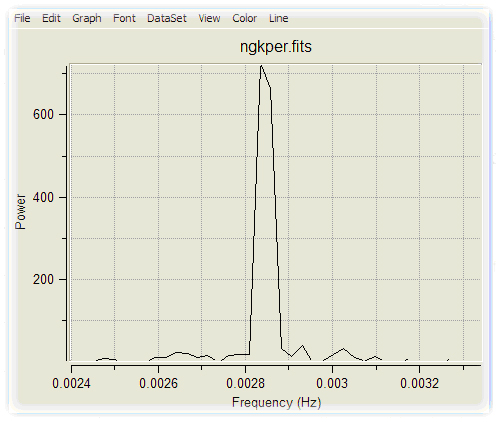
Figure 6. Light Curve of Cen X-3
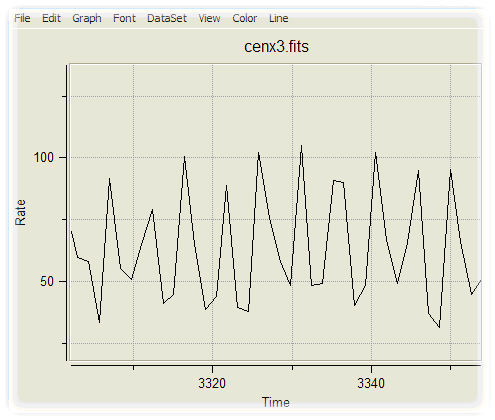
Figure 7. Power Spectrum of Cen X-3
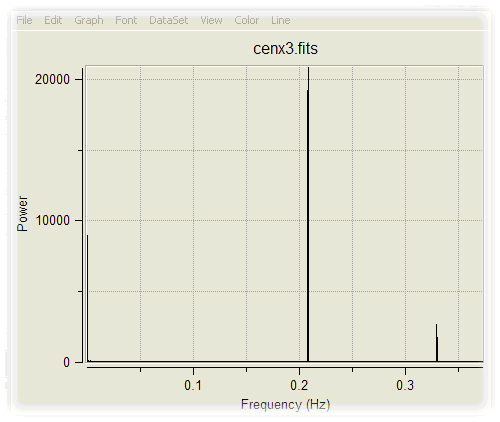
Figure 8. Zoom of Power Spectrum of Cen X-3
Revised: July 08, 2014