
Purpose: To produce 3-color composite images of supernova remnants (SNRs) from the Chandra X-Ray Observatory data showing areas of low, medium and high energies.
Introduction and Background - Images and Color:
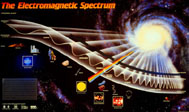
The colors we see are the result of how the human eye and brain perceive different wavelengths of light in the visible part of the electromagnetic spectrum – roughly radiation in the range of 380 nm to 740 nm. The ability of the human eye to distinguish colors is based on the varying sensitivity of different cells in the retina to light of different wavelengths.
A “false-color” image is an image that depicts a subject in colors that differ from those a faithful full-color photograph would show. The term false-color is typically used to describe images whose colors represent measured intensities outside the visible portion of the electromagnetic spectrum. Astronomical images are false-colored images. A false-color image is not incorrect – it is an arbitrary selection of colors chosen to represent some characteristic in an image, such as intensity, energy or chemical composition. The colors selected are representative of the physical processes underlying the objects in the images, and display in a single image as much information as possible that is available from the data. The data are transported into image analysis software where adjustments are made to emphasize the individual features or processes that scientists are interested in – or enhanced to make the images more interesting to the public.
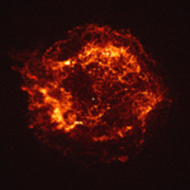
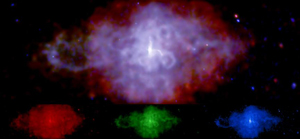
Cas A SNR (Chandra)
A “false-color” image is an image that depicts a subject in colors that differ from those a faithful full-color photograph would show. The term false-color is typically used to describe images whose colors represent measured intensities outside the visible portion of the electromagnetic spectrum. Astronomical images are false-colored images. A false-color image is not incorrect – it is an arbitrary selection of colors chosen to represent some characteristic in an image, such as intensity, energy or chemical composition. The colors selected are representative of the physical processes underlying the objects in the images, and display in a single image as much information as possible that is available from the data. The data are transported into image analysis software where adjustments are made to emphasize the individual features or processes that scientists are interested in – or enhanced to make the images more interesting to the public.
3C58 (Chandra)
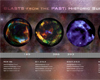
The X-ray image of the pulsar 3C58 on the left shows an image constructed by selecting different X-ray energy bands from the data and representing them with different colors – red, green, and blue. The result is a 3-color composite image. The low, medium, and higher X-ray energy bands of the Chandra data are shown as red, green, and blue respectively. In this particular image, red, green and blue represent X-ray energy bands of 0.5 to 1.0 kiloelectron volts, 1.00 to 1.5 kiloelectron volts, and 1.5 to 10 kiloelectron volts, respectively.
In this activity, two image analysis software programs, ds9 and ImageJ, are used to construct a 3-color composite image of the Cas A supernova remnant. The red, green, and blue regions in the composite will show the intensities of low, medium, and high-energy X-rays – as in the composite image of 3C58 above. The ds9 software utilizes data sets and astrophysical analysis tools from the Chandra X-Ray Observatory. The program uses the same process that X-ray astronomers follow in analyzing the data from Chandra observations. The download and installation instructions for the ds9 toolbox are located at http://chandra-ed.harvard.edu/install_2014.html. The introduction at http://chandra-ed.harvard.edu/learning_ds9overview.html describes the overview and purpose of the software and gives a short summary of the Chandra mission. The tutorial for using the ds9 software is located at http://chandra-ed.harvard.edu/learning_ds9overview.html. ImageJ is a software program developed by the National Institute of Health and is available for download from http://rsbweb.nih.gov/ij/download.html.
NOTE: It is not necessary to read the tutorial before beginning the 3-Color Composite Images - ds9 Activity . Complete instructions to use the image analysis tools in ds9 are given in the following procedure.
Procedure:
1.Download and install ds9 (http://chandra-ed.harvard.edu/install_2014.html)
2.Open ds9 and maximize the screen. From the pull down menus, choose Analysis>Virtual Observatories and choose Chandra-Ed Archive Server or New Rutgers X-ray Analysis Server from the list that appears.
3.Click Obs ID 114 ACIS OBSERVATION OF CAS A (first 5K seconds only) in the new window that appears.
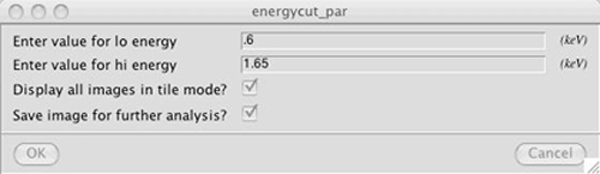
4.Use Analysis>Chandra Ed Analysis Tools>Energy Filter to show only the x-rays in the soft band (lo = 0.6 KeV, hi =1.65 KeV). Leave "Display all images in tile mode?" and "Save image for further analysis" checked.
5. The image will come up in a new frame on the right (if the right frame is not outlined in blue, click it). Saving the file on a PC: go to File>Save Frame as FITS. Name this file casared.fits. Saving the file on a Mac: go to File>Save. Under Selection in the new window that comes up, change the name of the file from /Users/username/ds9.fits to /Users/username/casared.fits. For both PC and Mac, choose Frame>Delete Frame to leave only your original image.
6.Repeat steps #4-5 for the medium (1.65-2.25 KeV) and the hard (2.25-7.50 KeV) bands, saving them as casagreen.fits and casablue.fits, respectively.
7.Download and install ImageJ and run the program.
8.Go to File>Open three times to load casared.fits, casagreen.fits and casablue.fits.
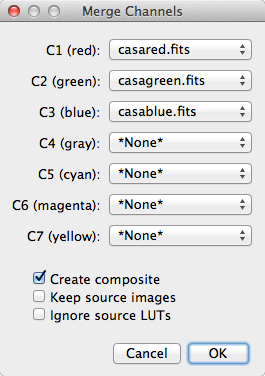
9.Go to Image>Color>Merge Channels. From the pull-down menus in the new window, choose the appropriate files to go with each color as shown below and click OK.
10. A three-color composite of Cas A has now been created. Use the following tools to enhance the image to emphasize different features.
- Image>Adjust>Size
- Image>Adjust/Brightness/Contrast
- Image>Adjust/Brightness/Color Balance
- Process>Smooth
- Process>Sharpen
Extension:
Use the same method to produce 3-color composite images for the following two objects.
Obs ID 7639 - A Deep Chandra Observation of the Tycho Supernova Remnant
Obs ID 115 - ACIS Observation of Tycho and Kepler
If the Obs ID for the supernova remnant (SNR) is not in list in the internal browser window, scroll to the middle of the page under Search the Chandra Public Archive for Other Observations and click on Unofficial Chandra Public Archive. Enter the Obs ID and click "Search" – then click on the Title of a returned observation to load it into ds9.

Revised: February 26, 2015