Discover and Explore with the Chandra Skymap
American Archives Month (each October) is an exciting time around here. We spend a lot of time working through the Chandra archive to bring you the best and most interesting objects in the X-ray Universe that have made their way across space and time (via photons) to Chandra's detectors.
It has been a personal goal of mine, since taking this job as Chandra science imager about four years ago, to create an interactive tool for the public to engage with the Chandra archive of released imagery in a new and innovative way. For this to work, a few pieces of the puzzle had to fall into place.
I've blogged about metadata before and -- as you might expect -- accurate, detailed and complete metadata for our entire archive of public images is the keystone to creating a tool such as the new Chandra Skymap. Metadata is what drives all of the content behind the application. Since there's no good way to automate the “retro-tagging” (that is, tagging images we’ve already released in the past) of our image archive, it took a few years to get through all of those images by hand. We finally completed that task at the end of last year and then set our sights upon creating the Skymap tool.
There were some false starts along the way, mainly due to limitations as a programmer, learning new languages and libraries. But as I was pulling my hair out trying to figure this out last summer, a colleague recommended utilizing javascript with the D3 (Data-Driven Documents) visualization library. I was vaguely familiar with D3, mainly from playing around with interactive data visualizations published by The New York Times and written by Mike Bostock (the creator of D3). D3 turned out to be the answer to the coding problems, but the new challenge was to learn javascript. Thankfully, the D3 documentation is extensive and Mike Bostock and many other programmers have provided a wealth of resources in the form of small bits of example code that could be utilized as part of a larger project. Through all of this, I developed two new skills: first, the ability to completely tax my computer by testing how many browser tabs I could hold open at once, and, second, honing the ability to construct the perfect Google query regarding a particular javascript or D3 question. Utilizing countless examples and answers to questions on StackExchange, I was able to build the Skymap I had pictured in my head years ago. This has been an extremely rewarding and fulfilling project and I'm very excited to share this new application with you today!
Here are some helpful tips to get you started using the new Chandra Skymap:
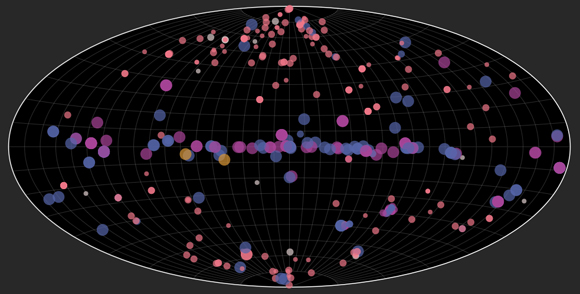
1. Everything about this tool is interactive. You can zoom into the map using your mouse scroll wheel, or by pinch-zoom, or using the buttons at the top left. You can also pan around by clicking and dragging while in zoom-mode.
2. You'll notice that as you hover over data points, the points are highlighted and a small information window pops up with a synopsis of the press release for that particular object. Each data point is also a link to the release for that object. Click on the point and you will go to its Photo Album page.
3. The controls at the bottom offer up various ways for you to filter the data to your liking. Also note that most of the text in the controls are actually links to more information -- click on them to find out more. If you're only interested in which distant galaxies Chandra has observed, de-select everything but "Galaxies & Galaxy Clusters" in the "Categories" panel and you'll only see distant galaxies in the Skymap.
4. If you would like to filter the data by the date of the release, click and drag to draw a box in the bottom panel "Release Date Filter" and then resize to your liking or drag it across the timeline to watch press releases pop into and out of the Skymap as you pan across time.
5. You might notice that some areas are clustered with overlapping data points. Some of these are multiple releases for the same object at different times, or closely spaced but separate objects. Careful use of the zoom feature and/or filters should allow you to uncover any data point. For example, if you happen to notice two data points from two different categories overlapping each other, you can toggle the category underneath off and then on to bring it to the front. Using the "Release Data Filter" can also help to uncover buried data points.
6. If you see a term on the map that you are unfamiliar with, click on the underlined link to find out more either from the Chandra site, or from Wikipedia.
Be sure to come back often, as the Chandra Skymap will instantly populate with new releases as they are published. We also envisioned some new features that will hopefully be added in the near future.
Enjoy discovering all that Chandra has to offer!
-Joe DePasquale, CXC